


phototechno/iStock via Getty Images
Like Warren Buffett, Apple (NASDAQ:AAPL) is my favorite company purely from a fundamentals perspective.
Apple is now an aspirational global luxury brand synonymous with modern living, convenience, technology that works, and a good life.
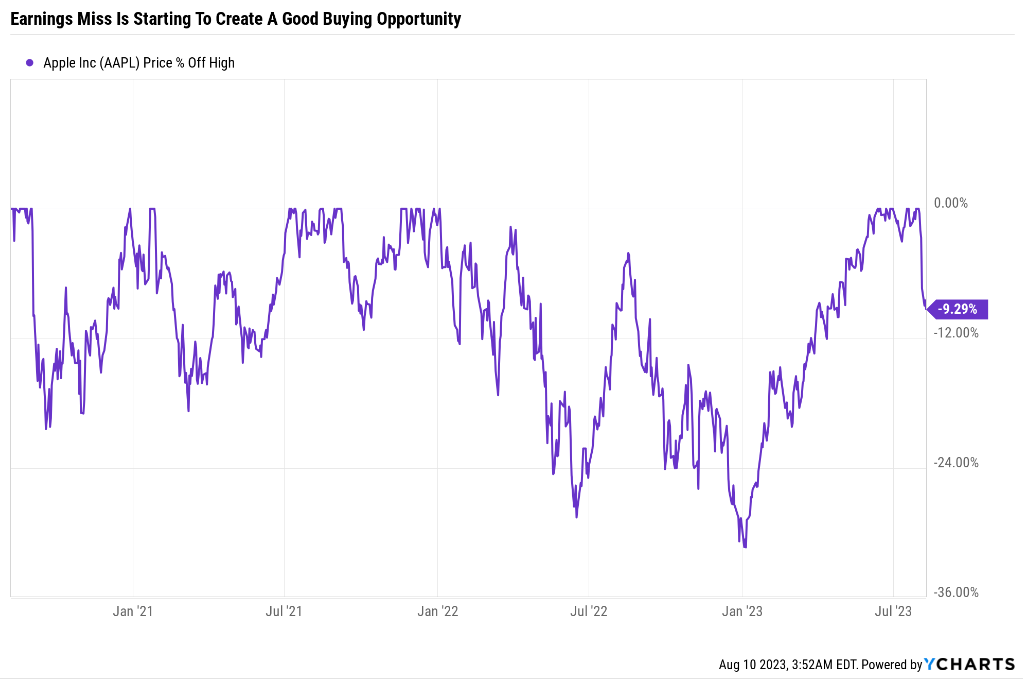
Several have asked me to provide an update about Apple, specifically following its post-earnings “crash.”
I’m not going to give you the 20th “What Apple’s Earnings looked like” article because that’s not valuable to you. Apple’s earnings disappointed; that’s all you need to know.
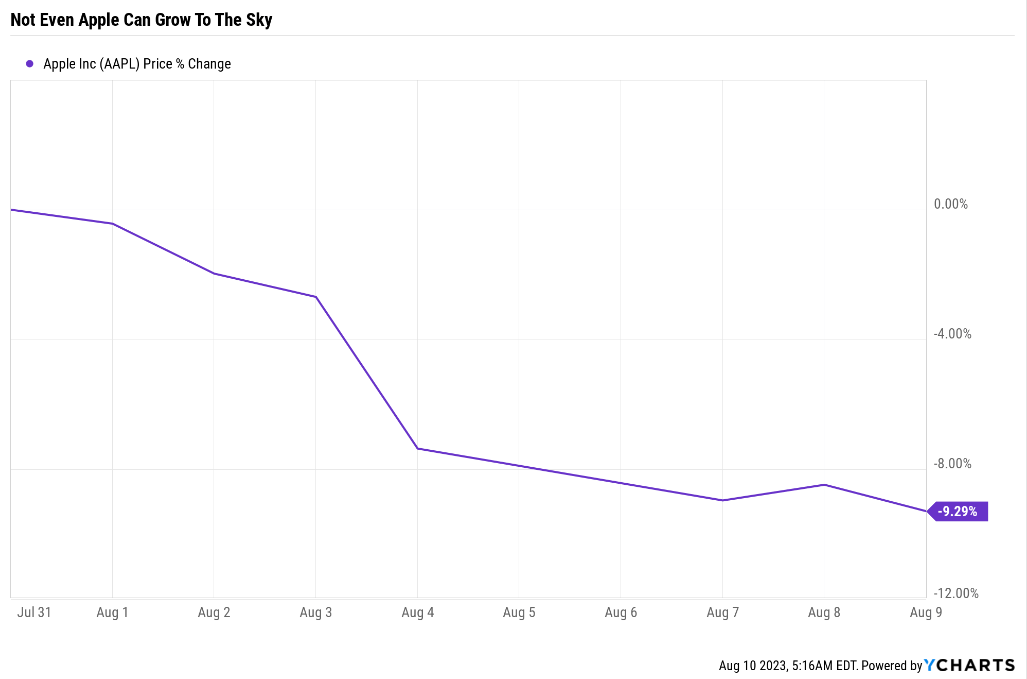
Ycharts
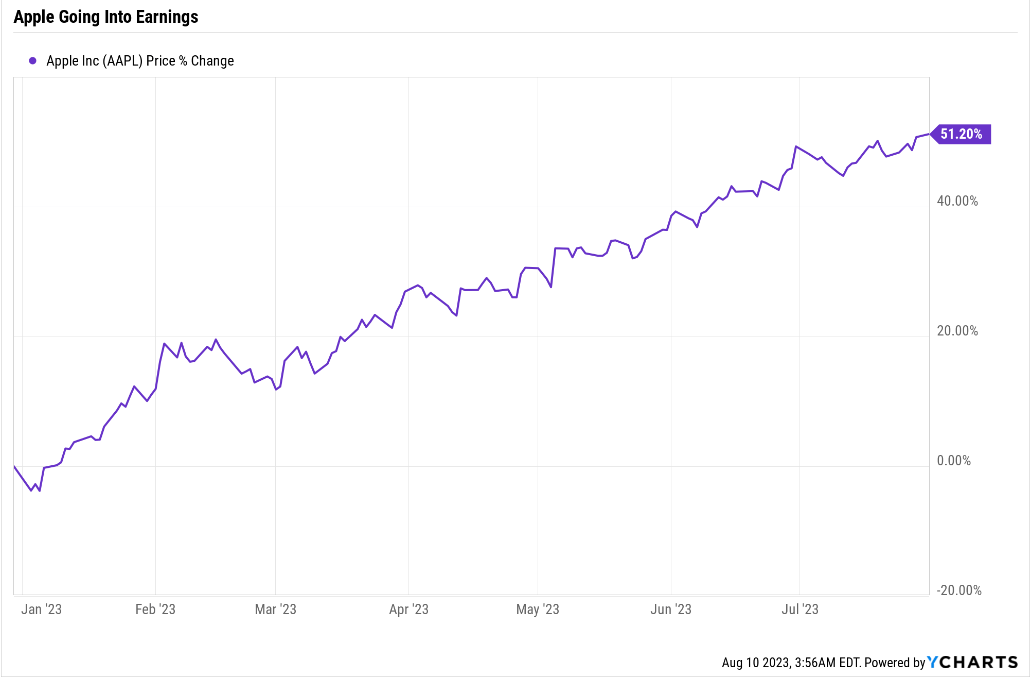
It might seem like a dramatic decline for Apple in the last few days, but let’s remember what happened just before that.
Ycharts
A 51% rally that was most definitely not sanctified by the righteousness of fundamentals.
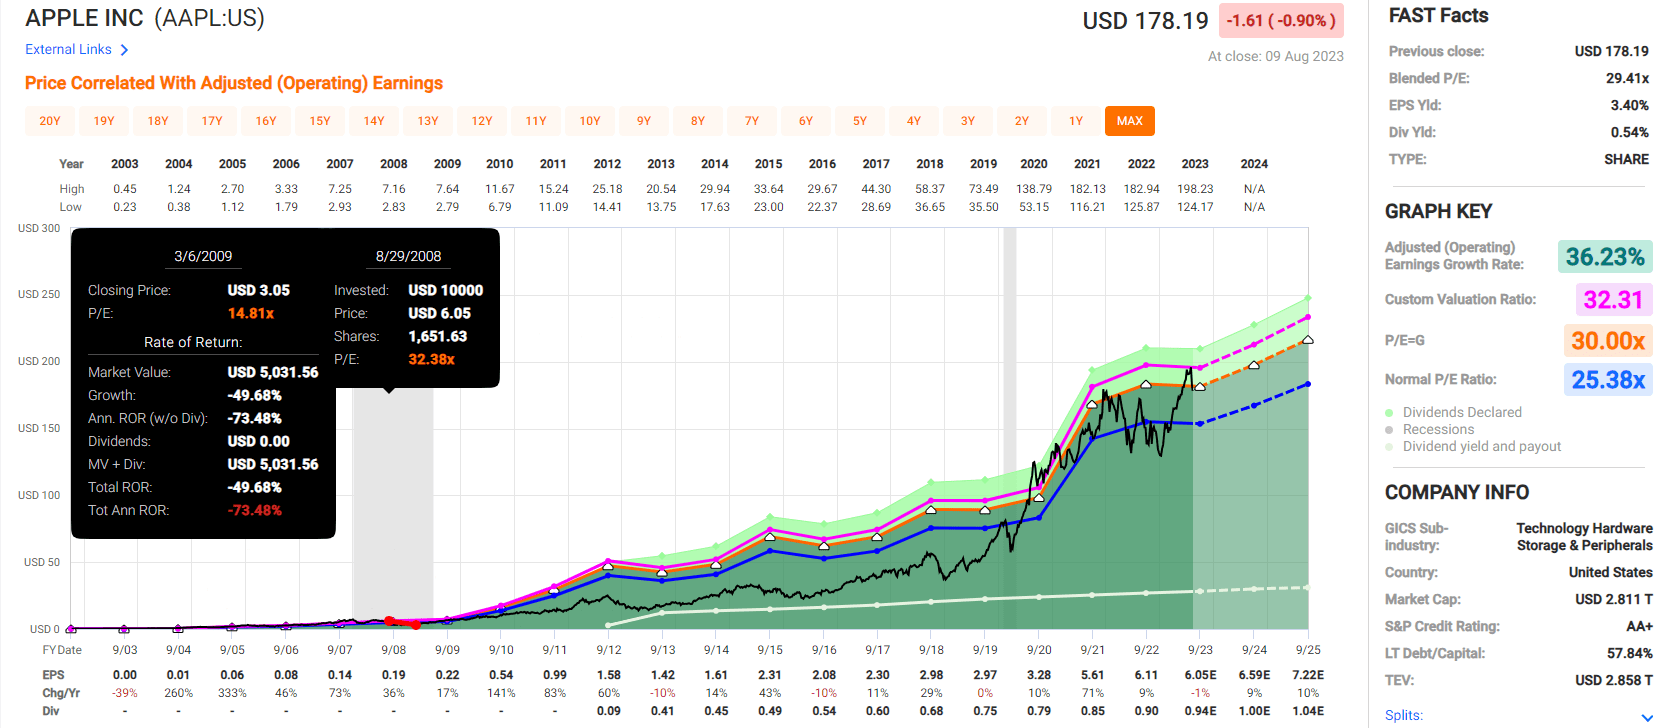
Fact: 32.3X Earnings Is Not A Reasonable Valuation For Apple

FAST Graphs, FactSet
Anyone who told you that 32X earnings were a reasonable price for Apple was asking you to speculate, not follow any evidence-based investing.
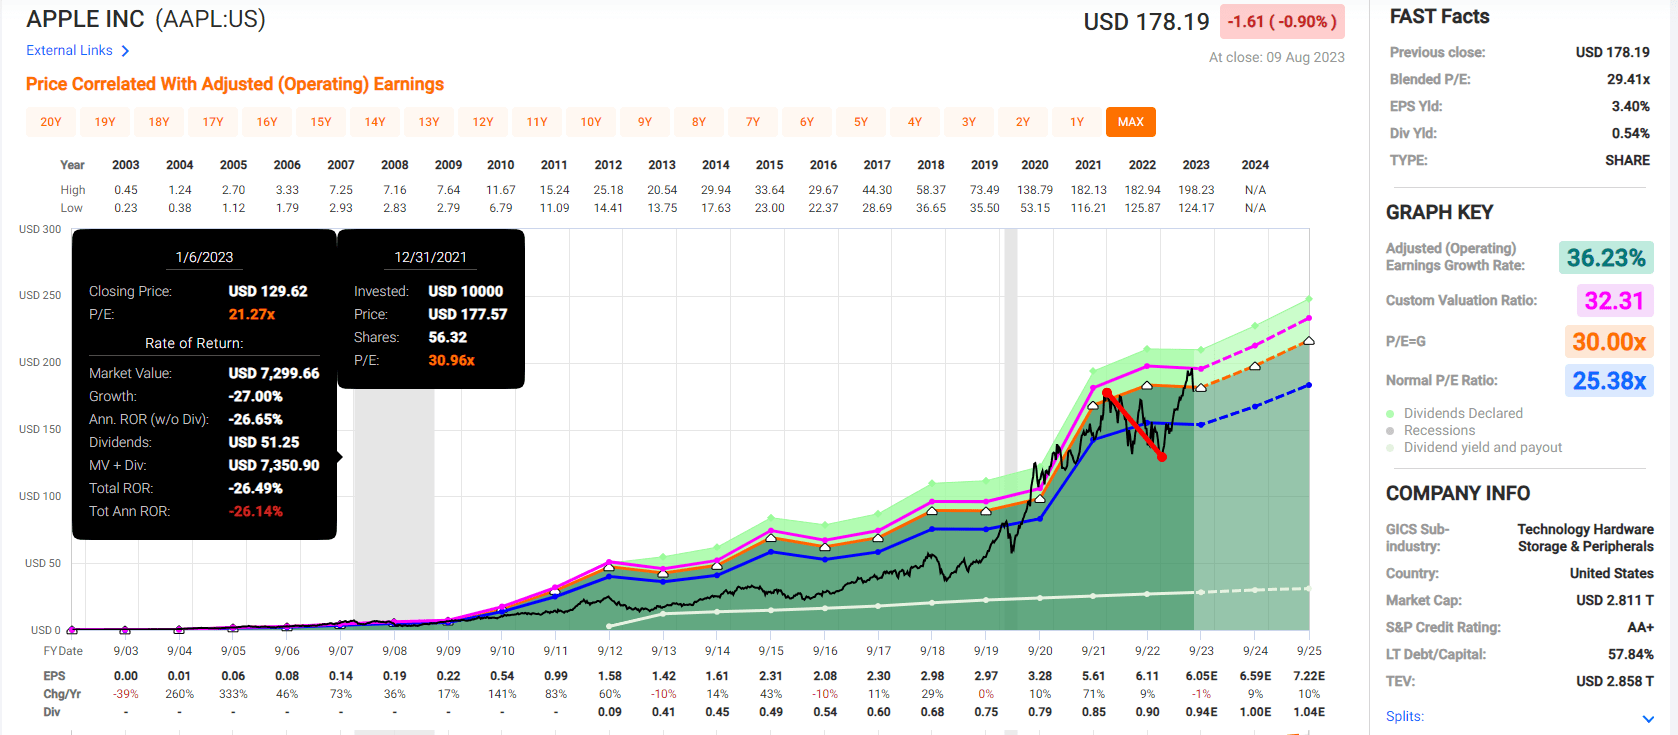
The Last Time Apple Was 32X Earnings Outside Of The Pandemic Bubble
FAST Graphs, FactSet
During the pandemic, a record $9 trillion in stimulus helped cause a 71% surge in earnings, pushing Apple to a dangerous 31X earnings.
FAST Graphs, FactSet
That was followed by a healthy and completely expected bear market that brought Apple down to a historically 16% undervalued 21X earnings.
And then the 2023 tech rally took Apple to 32X earnings, and once again, “this time was different” and “no price too high” because some greater fool will pay even more.
The Shocking Truth About Apple: Analysts Are Lying To You (Unless You Understand How Wall Street Works)
Loving Apple has become a religion for some consumers and most Wall Street analysts.
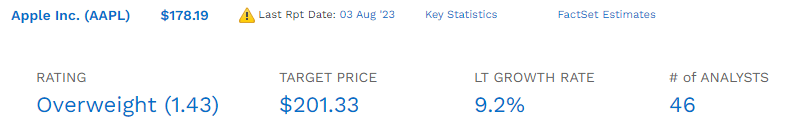
FactSet Research Terminal
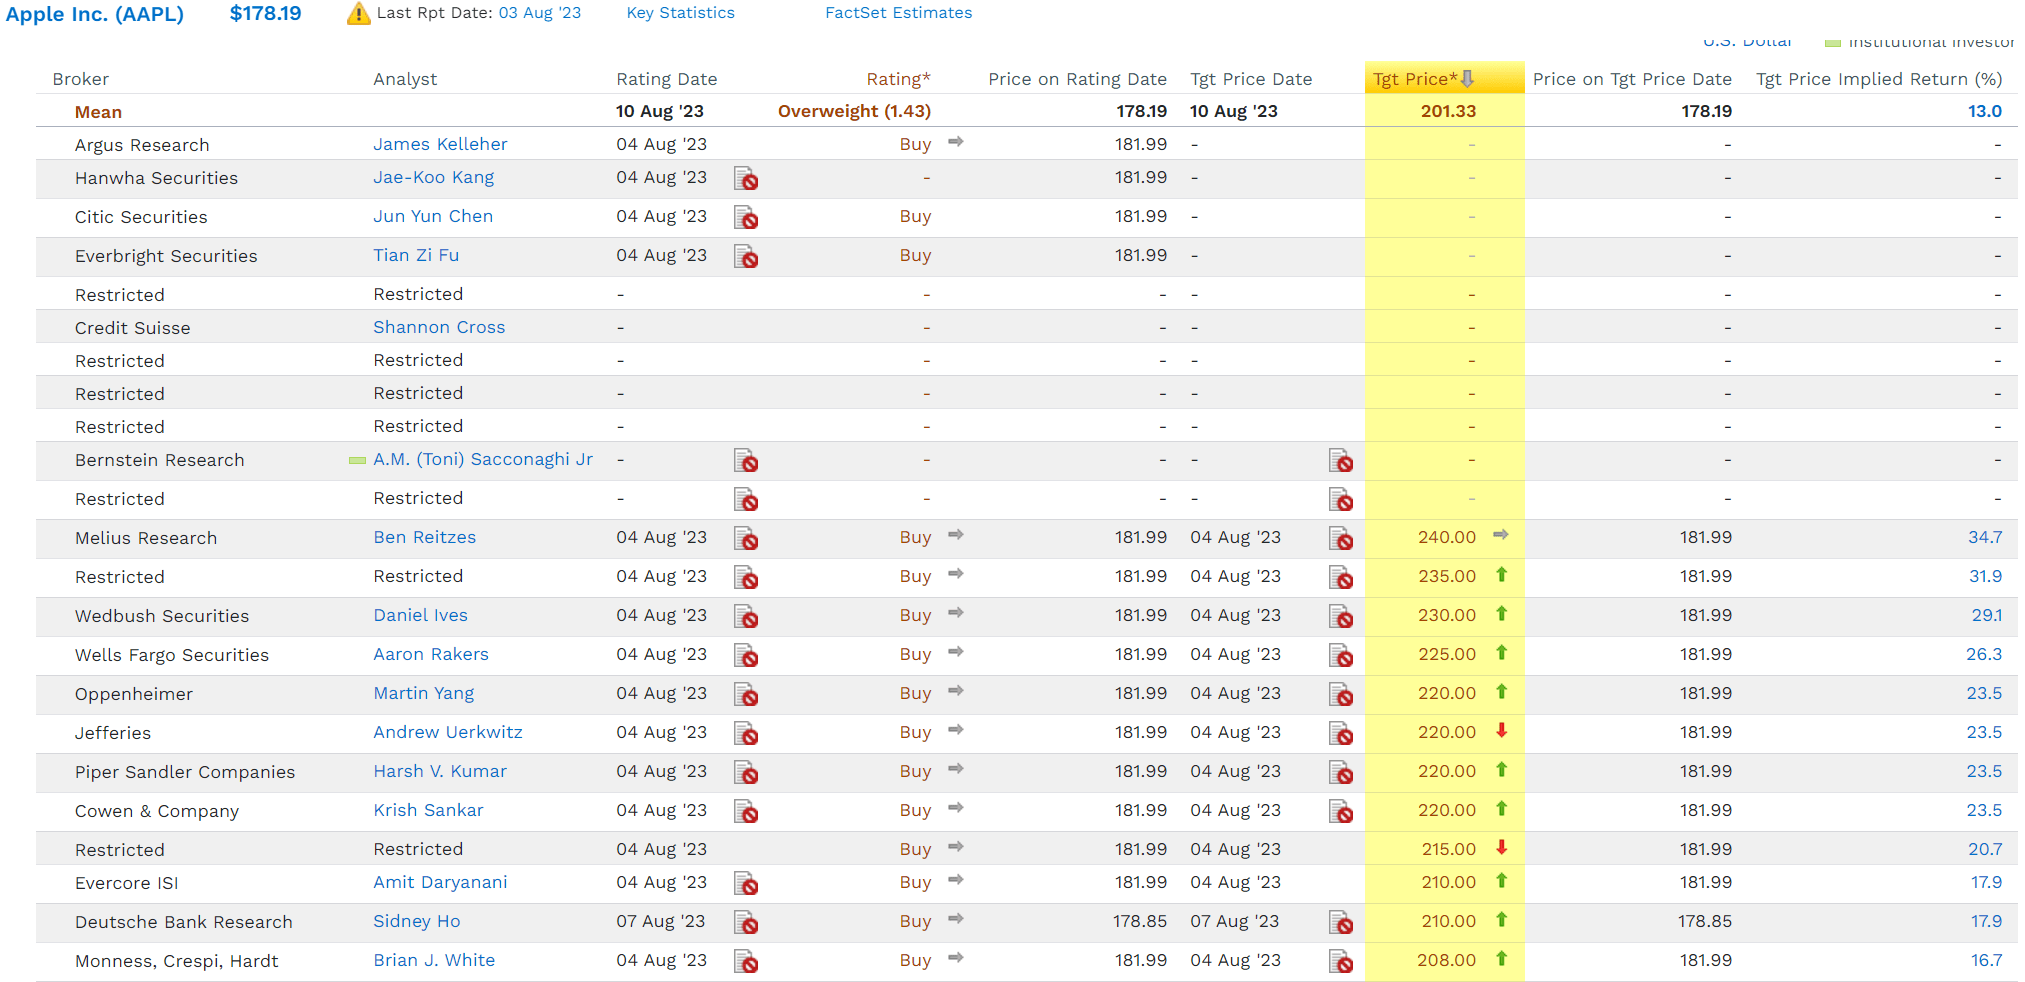
The 12-month median price target on Apple is $201.33. Does this mean all 46 analysts covering Apple for a living think it’s worth $201.33 right now?
Not in the slightest.
|
Analyst Median 12-Month Price Target |
Morningstar Fair Value Estimate |
| $201.33 (30.8X forward earnings) | $150.00 (23X earnings) |
|
Discount To Price Target (Not A Fair Value Estimate) |
Discount To Fair Value |
| 11.49% | -18.79% |
|
Upside To Price Target (Not Including Dividend) |
Upside To Fair Value (Not Including Dividend) |
| 12.99% | -15.82% |
|
12-Month Median Total Return Price (Including Dividend) |
Fair Value + 12-Month Dividend |
| $202.25 | $150.92 |
|
Discount To Total Price Target (Not A Fair Value Estimate) |
Discount To Fair Value + 12-Month Dividend |
| 11.90% | -18.07% |
|
Upside To Price Target (Including Dividend) |
Upside To Fair Value + Dividend |
| 13.50% | -15.30% |
Do Wall Street analysts believe that 30.8X forward earnings are fair value for Apple?
Does This Look Like Market-Determined Fair Value To You? Or The Triumph Of Hope Over Experience?

FAST Graphs, FactSet
Analyst price targets are created by applying an analyst’s earnings or cash flow estimates or some other fundamental metric by some made-up guesstimate valuation multiple.
Consider Melius Research’s Ben Reitze and his $240 12-month forecast on Apple.
- $240 = 36.7X 12-month forward earnings
Does Anyone Suggest A Rational Human Thinks 37X Earnings Is “fair value” For Apple?
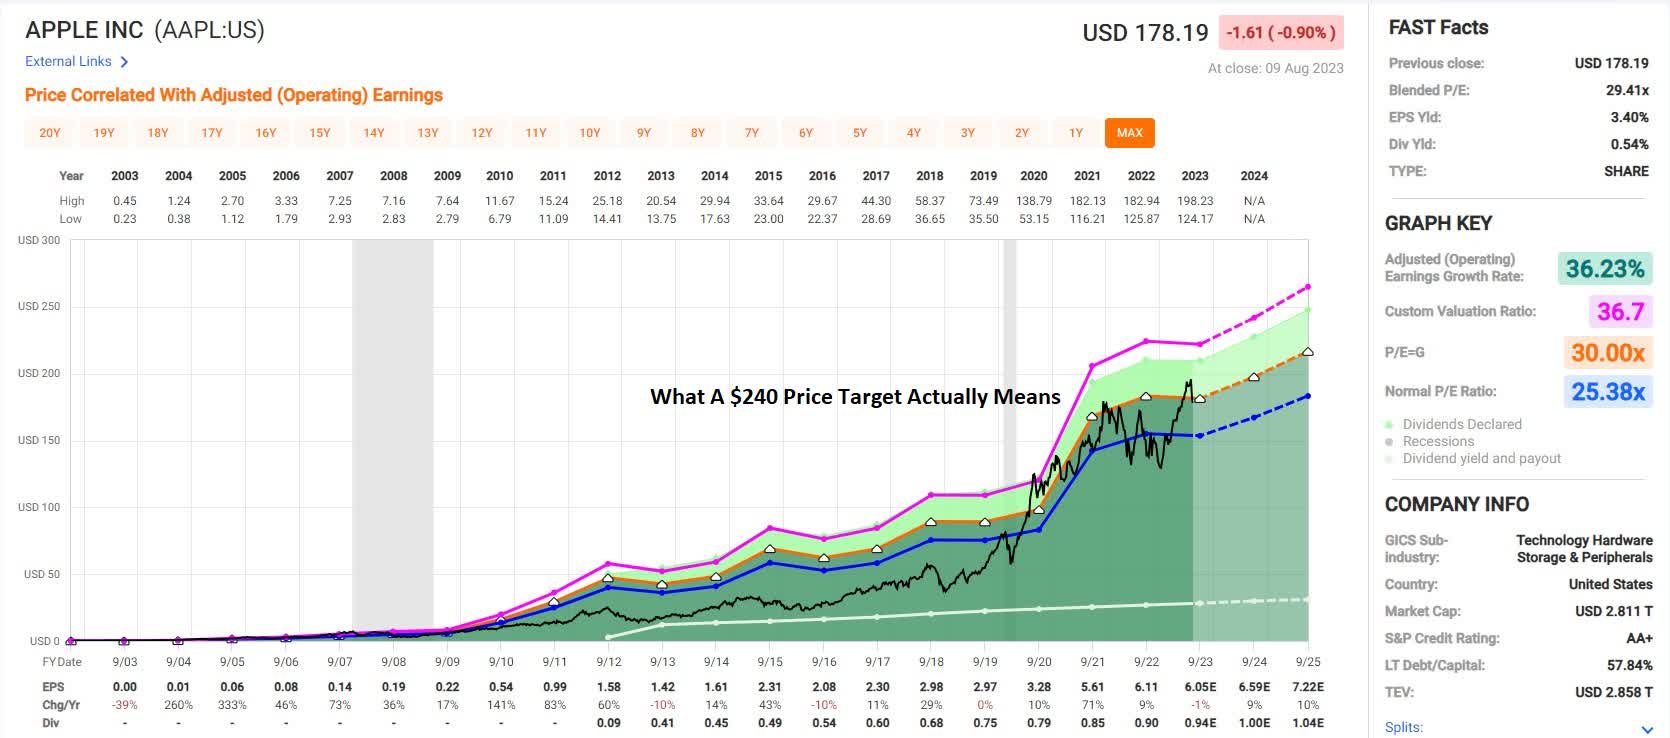
FAST Graphs, FactSet
During the Pandemic stimulus bubble, Apple has traded at 37X earnings just once in the last 20 years.
No rational analyst can think that 37X earnings is any fair value or sustainable long-term.
Melius Research is just chasing momentum and trying to guess where Apple will likely be in a year.
Morningstar is at least honest and applies a true discounted cash flow analysis. That’s just one model that estimates Apple is worth 23X forward earnings — a far more reasonable estimate given the following fact.
Apple Is A Wonderful Company But No Longer A Growth Stock
Apple grew earnings at 36% annually for 20 years, a remarkable 485-fold in two decades.
Here’s what Apple’s growth prospects look like now.
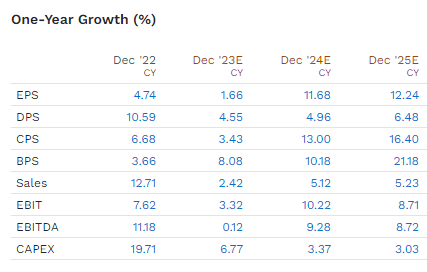
Apple Medium-Term Growth Prospects
| Metric | 2022 Growth | 2023 Growth Consensus | 2024 Growth Consensus |
2025 Growth Consensus |
| Sales | 11% | 1% | 7% | 6% |
| Dividend | 7% | 5% | 5% | 2% |
| Earnings | 9% | -1% | 9% | 10% |
| Operating Cash Flow | 21% | -1% | 7% | 8% |
| Free Cash Flow | 24% | -3% | 7% | 5% |
| EBITDA | 12% | 0% | 7% | 5% |
| EBIT | 13% | -1% | 7% | 7% |
(Source: FAST Graphs, FactSet)
Apple’s earnings are growing at a decent clip, slightly above the S&P’s long-term 8.5% analyst consensus.
But just barely, and in the short term, Apple’s earnings growth lags the market.
S&P 500 Growth Consensus (Bottom Up, All 500 Company’s Individual Growth Estimates Weighted By Market Cap)
FactSet Research Terminal
- 8.4% CAGR EPS growth from 2022 through 2025
That’s the long-term consensus for the S&P 500’s long-term earnings, driven higher by big tech’s continued global domination of things like cloud computing.
- 1.5% yield + 8.5% growth = 10% CAGR long-term return potential
The market’s historical return is 10%. Faster growth from big tech won’t improve that, not at current valuations.
Apple’s earnings are expected to grow at 6.9% CAGR through 2025. Does that sound like a growth stock to you?
Apple’s Medium-Term Growth Outlook
| Year | Sales | Free Cash Flow | EBITDA | EBIT (Operating Income) | Net Income |
| 2022 | $391,486 | $109,390 | $129,326 | $117,913 | $98,700 |
| 2023 | $388,831 | $104,817 | $127,786 | $115,340 | $96,786 |
| 2024 | $413,527 | $111,099 | $136,351 | $123,711 | $103,018 |
| 2025 | $441,685 | $118,397 | $143,418 | $133,380 | $110,599 |
| 2026 | $485,564 | $132,166 | $151,445 | $148,565 | $120,856 |
| 2027 | $540,656 | $148,141 | $168,523 | $168,515 | $134,220 |
| 2028 | $598,762 | $163,012 | $187,525 | $186,049 | $144,198 |
| Annualized Growth 2022-2028 | 7.34% | 9.23% | 6.39% | 7.90% | 8.30% |
| Cumulative 2023-2028 | $2,869,025 | $777,632 | $915,048 | $875,560 | $709,677 |
(Source: FAST Graphs, FactSet)
Apple’s $800 billion in cumulative free cash flow over the next five years is incredible. Its 9% free cash flow growth rate is not.
Apple Margin Consensus: Stable But Not Likely To Improve
| Year | FCF Margin | EBITDA Margin | EBIT (Operating) Margin | Net Margin |
| 2022 | 27.9% | 33.0% | 30.1% | 25.2% |
| 2023 | 27.0% | 32.9% | 29.7% | 24.9% |
| 2024 | 26.9% | 33.0% | 29.9% | 24.9% |
| 2025 | 26.8% | 32.5% | 30.2% | 25.0% |
| 2026 | 27.2% | 31.2% | 30.6% | 24.9% |
| 2027 | 27.4% | 31.2% | 31.2% | 24.8% |
| 2028 | 27.2% | 31.3% | 31.1% | 24.1% |
| Annualized Growth 2022-2028 | -0.43% | -0.89% | 0.52% | -0.66% |
(Source: FAST Graphs, FactSet)
Apple’s margins are not expected to improve, not even with more service sales.
This is a mature business; nothing about Apple’s current or near-term business prospects is expected to change that.
Source: FactSet Research Terminal
Why are analysts “overweight” Apple? Why do they collectively guess it will be up 13% to 14% a year from now?
Because it’s up over 40% year-to-date, and they would look like idiots if they didn’t tell everyone what they wanted to hear, which is that Apple will keep delivering double-digit gains every year.
No large-cap money manager on Wall Street can sleep well at night and have job security unless they own Apple. That’s a fact. And this is what the analysts are doing, providing “cover your backside” rationalization for owning the world’s best company.
Apple Isn’t Likely To Beat The Market In The Future If It Grows As Expected
| Investment Strategy | Yield | LT Consensus Growth | LT Consensus Total Return Potential | Long-Term Risk-Adjusted Expected Return |
| Schwab US Dividend Equity ETF | 3.6% | 9.70% | 13.3% | 9.3% |
| Nasdaq | 0.8% | 11.2% | 12.0% | 8.4% |
| Vanguard Dividend Appreciation ETF | 1.9% | 9.7% | 11.6% | 8.1% |
| REITs | 3.9% | 7.0% | 10.9% | 7.6% |
| Dividend Champions | 2.6% | 8.1% | 10.7% | 7.5% |
| Dividend Aristocrats | 1.9% | 8.5% | 10.4% | 7.3% |
| S&P 500 | 1.5% | 8.5% | 10.0% | 7.0% |
| Apple | 0.5% | 9.20% | 9.7% | 6.8% |
| 60/40 Retirement Portfolio | 2.1% | 5.1% | 7.2% | 5.0% |
(Source: FactSet Research Terminal, Morningstar)
Apple isn’t going to give you Buffett-like returns long term. Not as a mature luxury brand.
It might be around for centuries and have more money than God, but let’s be realistic. Apple is not a growth stock; anyone who tells you otherwise is speculating about some future product that no one has even thought of or is lying to you.
Buying Apple Undervalued: The Only Way You Will Ever Outperform The Market With This Stock
The Vatican has about $65 billion in assets. Apple’s cash pile is three times that size, generating more than $100 billion annually in free cash flow. Apple could be said to have more money than God, and its buybacks are the stuff of legend.
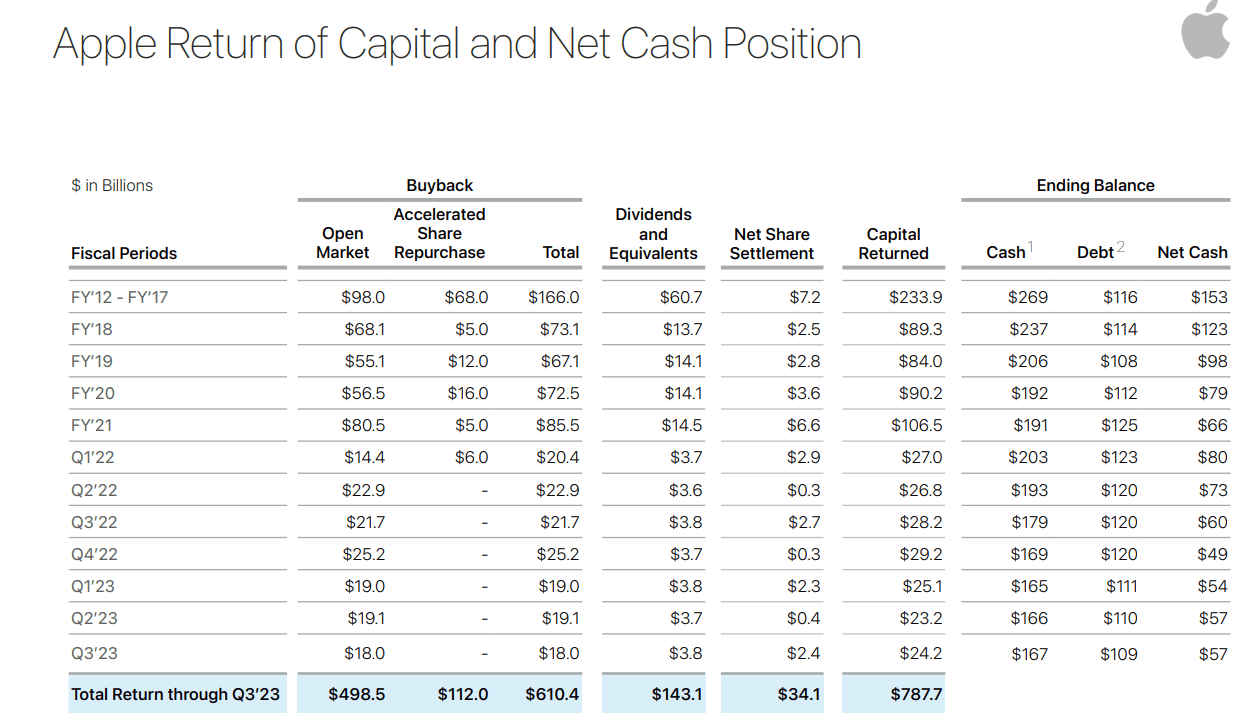
Apple
Apple has returned almost $800 billion to shareholders so far, and its buybacks are expected to total $160 billion between 2023 and 2024.
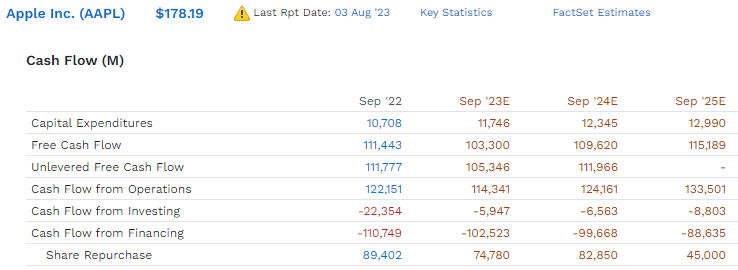
FactSet Research Terminal
Don’t worry about that $45 billion forecast in 2025. It’s likely a handful of low estimates. The chances that Apple will cut buybacks in half in the face of $60 billion in net cash and a fast-growing pile of cash is pretty small.
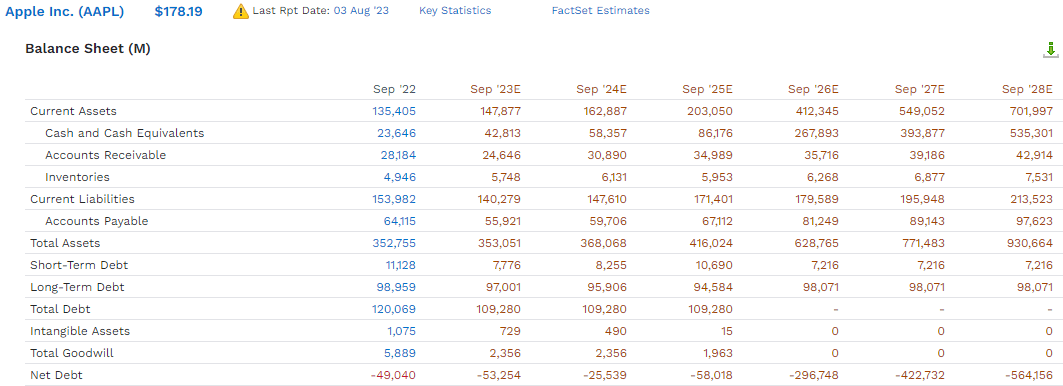
FactSet Research Terminal
But anyone who thinks that Apple will be able to keep a relentless bid under its stock price that prevents future corrections?
Ycharts
Nope, market gravity still exists, and anyone who tells you otherwise is a fool, a liar, or trying to sell you something.
What Apple Is Worth
| Metric | Historical Fair Value Multiples (all-Years) | 2022 | 2023 | 2024 | 2025 |
12-Month Forward Fair Value |
|
| PE | 25.38 | $154.56 | $156.85 | $171.57 | $188.57 | ||
| Average | $154.56 | $156.85 | $171.57 | $188.57 | $165.91 | ||
| Current Price | $178.19 | ||||||
|
Discount To Fair Value |
-15.29% | -13.61% | -3.86% | 5.51% | -7.40% | ||
|
Upside To Fair Value (Including Dividends) |
-13.26% | -11.98% | -3.72% | 5.83% | -6.38% | ||
| 2023 EPS | 2024 EPS | 2023 Weighted EPS | 2024 Weighted EPS | 12-Month Forward PE | 12-Month Average Fair Value Forward PE | Current Forward PE |
Cash-Adjusted PE |
| $6.18 | $6.76 | $2.38 | $4.16 | $6.54 | 25.38 | 27.26 | 21.7 |
Even adjusting for cash on the balance sheet, Apple trades 22X earnings for a company growing at single digits.
It’s historically worth 25X earnings, similar to the historical multiples for big tech like Amazon (AMZN) (cash flow) and Microsoft (MSFT) and Alphabet (GOOG) (GOOGL) (earnings).
And that 25X multiple for big tech includes the last decade, “free money forever.”
So don’t think the Fed cutting rates back to 3.75% will justify 30+ multiples.
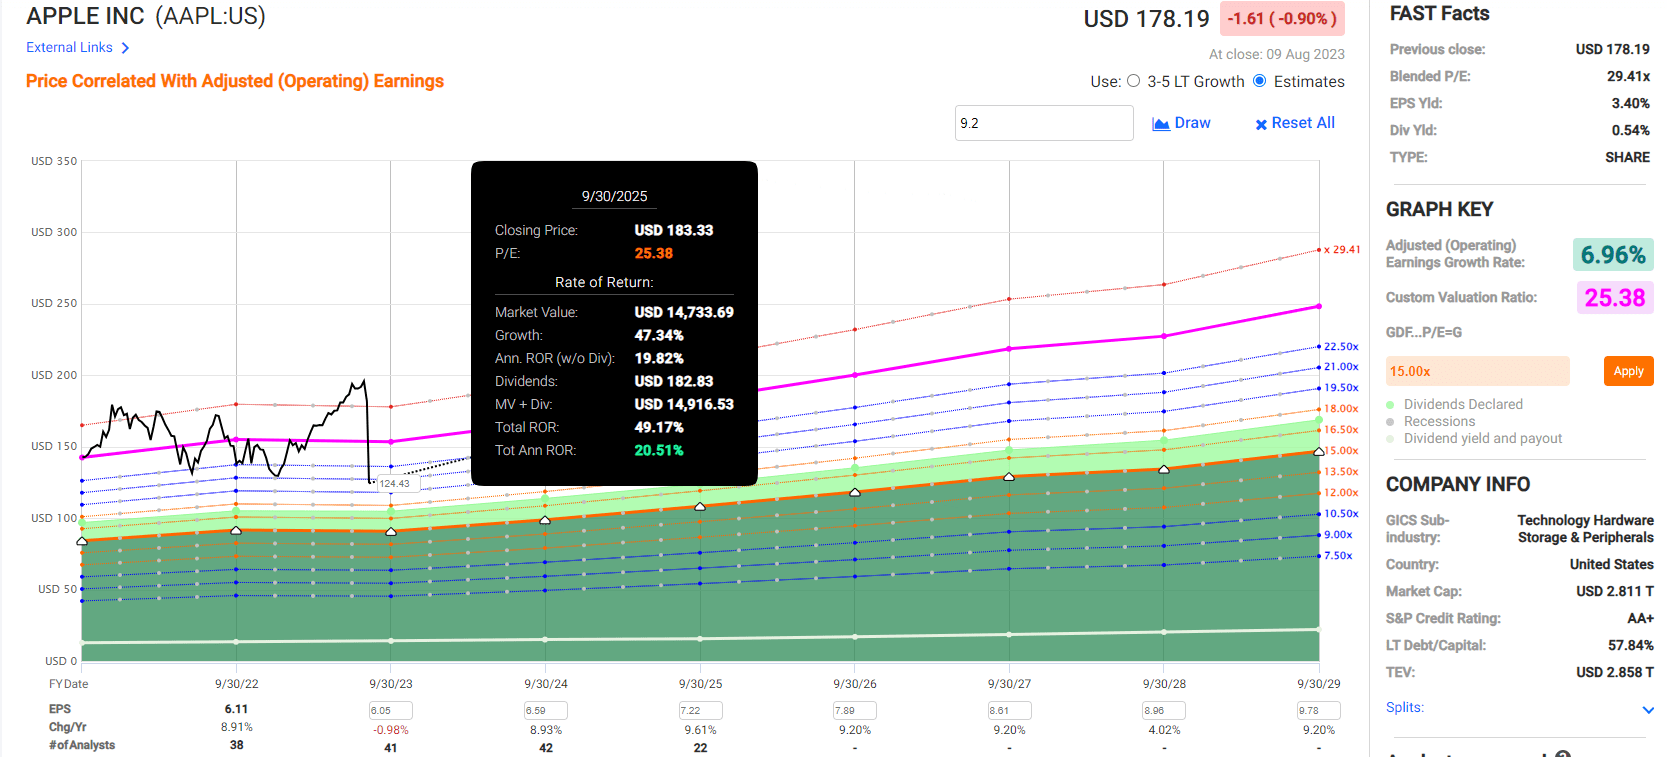
| Rating | Margin Of Safety For Medium-Risk 13/13 Ultra SWAN | 2023 Fair Value Price | 2024 Fair Value Price | 12-Month Forward Fair Value |
| Potentially Reasonable Buy | 0% | $156.85 | $171.57 | $165.91 |
| Potentially Good Buy | 5% | $149.01 | $162.99 | $157.61 |
| Potentially Strong Buy | 15% | $133.32 | $145.83 | $141.02 |
| Potentially Very Strong Buy | 25% | $111.75 | $128.68 | $124.43 |
| Potentially Ultra-Value Buy | 35% | $101.95 | $111.52 | $107.84 |
| Currently | $178.19 | -13.61% | -3.86% | -7.40% |
| Upside To Fair Value (Including Dividends) | -11.44% | -3.18% | -6.35% |
Buy Apple at $166, and you can expect to earn 9.7% long-term returns with a 0.29% fundamental risk of losing everything.
- AA+ stable credit rating = 0.29% 30-year bankruptcy risk
- Apple’s credit rating is as strong as the US Treasury’s
If you want to earn double-digit long-term returns on Apple, you will have to buy it when it’s undervalued.
Apple 2025 Consensus Total Return Potential
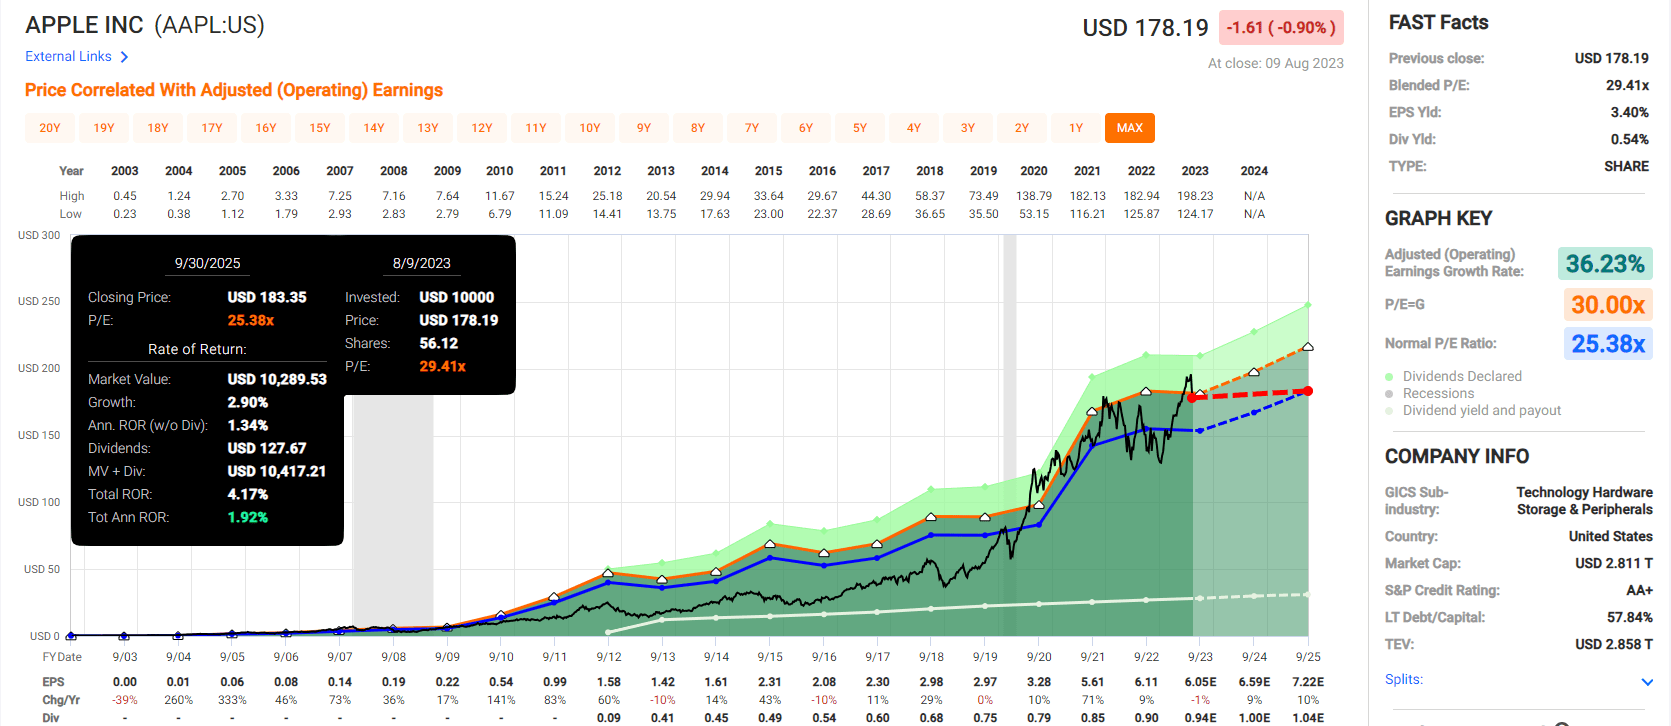
FAST Graphs, FactSet
Congrats to anyone buying Apple today! You can expect to break even by the end of September 2025! Adjusted for inflation you should still expect to lose money.
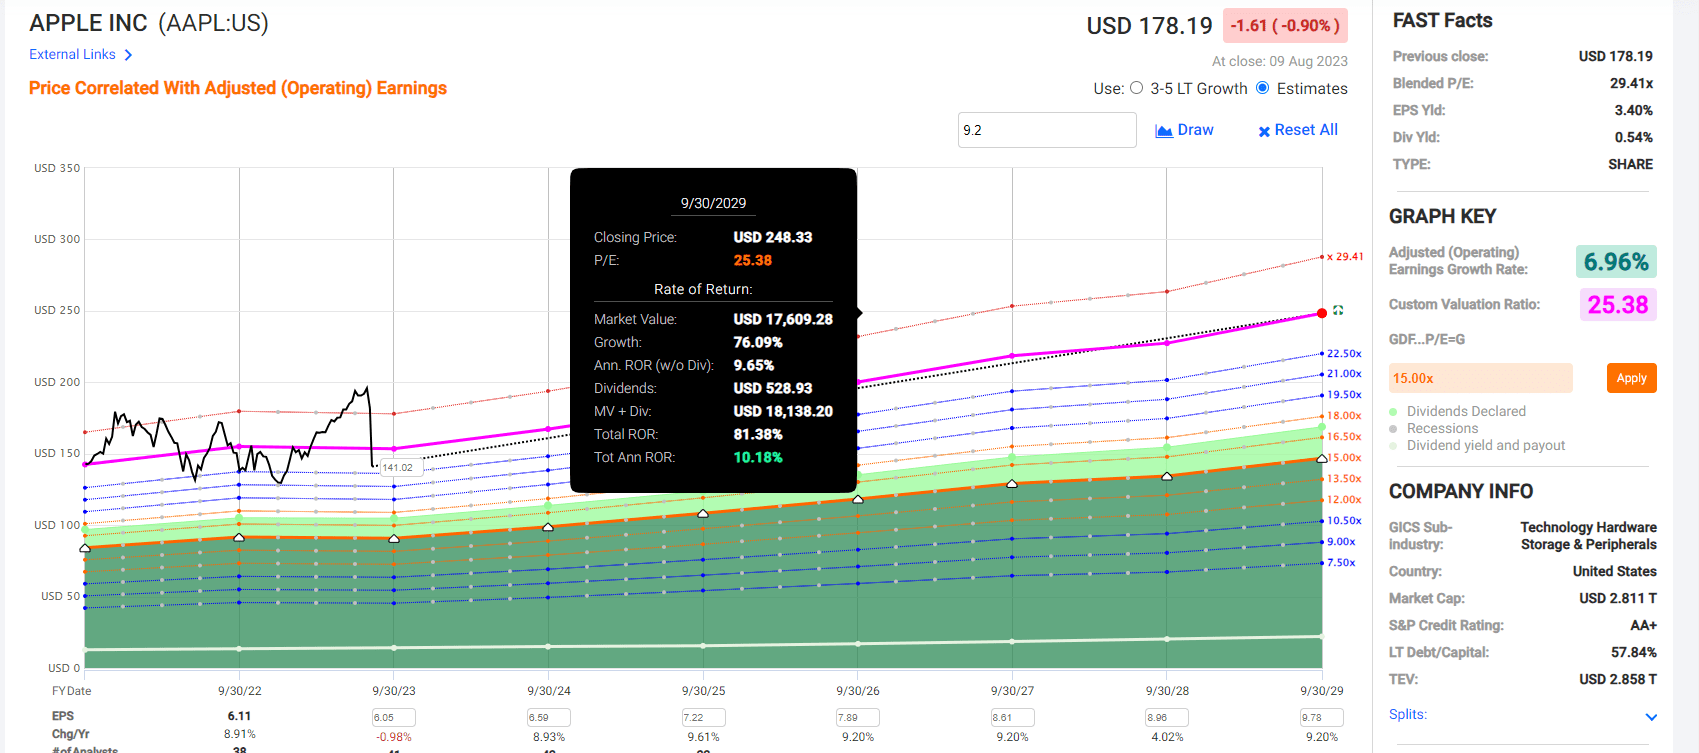
Apple 2029 Consensus Total Return Potential
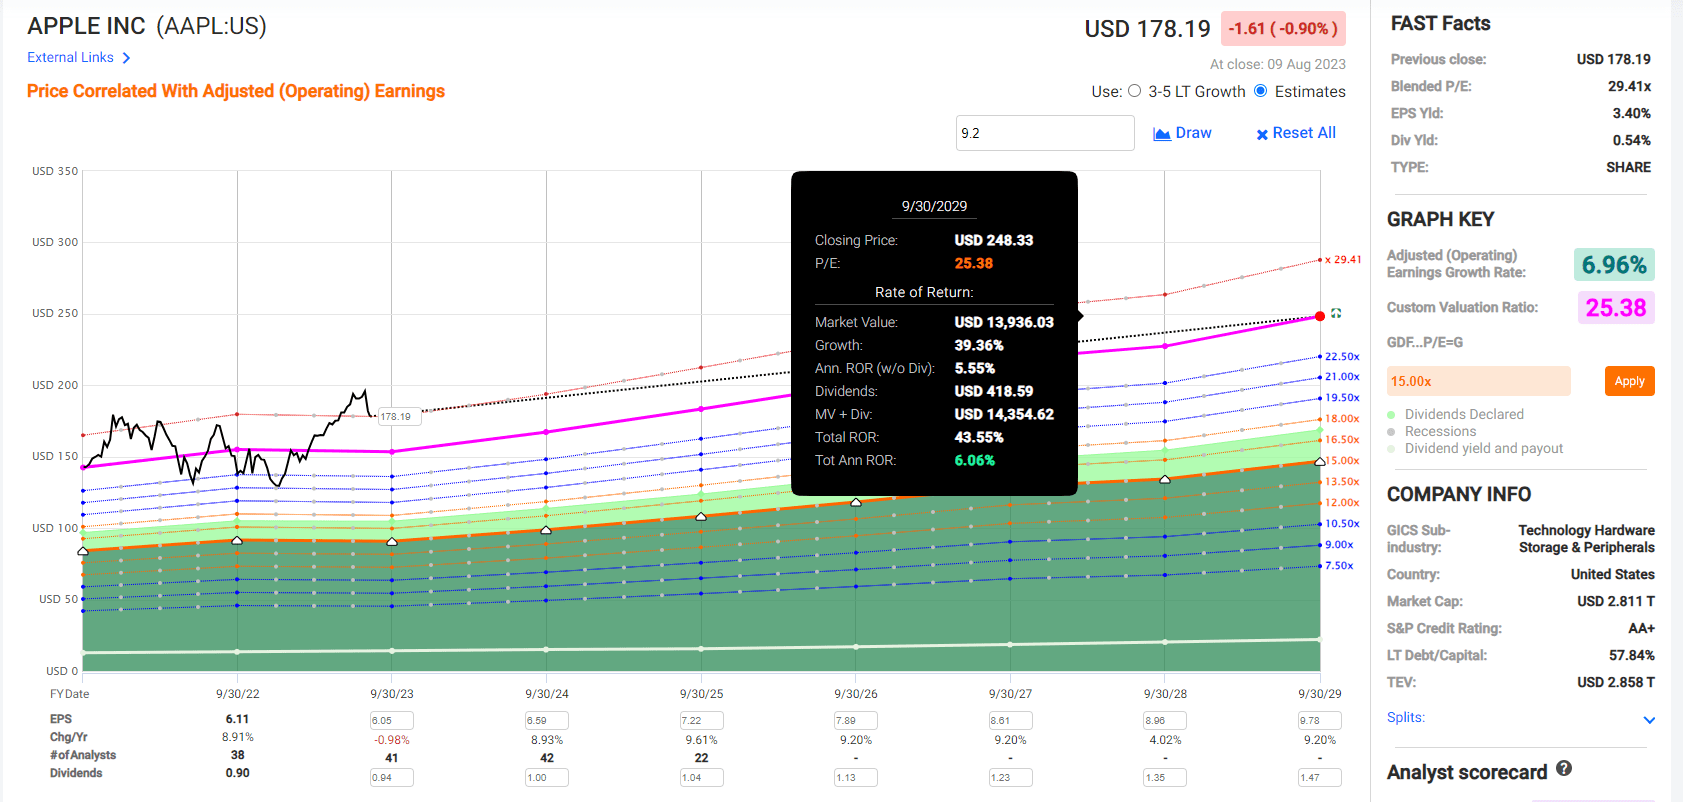
FAST Graphs, FactSet
Through 2029 analysts expect the S&P to do about 40% total returns from here. That’s about what Apple is expected to deliver around 3% inflation-adjusted returns.
Shockingly bad, right? For anyone used to Buffett-like returns from Apple, including Warren Buffett himself!
Do you know why Buffett isn’t selling Apple? Because of the giant tax bill it would generate. Buffett has said Berkshire is no longer trying to deliver massive returns – it’s trying to be a responsible steward of shareholder capital.
Buffett is trying to match the S&P, and Apple can do that in the future, so Berkshire is sticking with Apple.
How to Earn Buffett-Like Returns From Apple In The Future
There’s only one way to earn Buffett-like 20% annual returns from a mature business like Apple. You have to buy it at a discount.
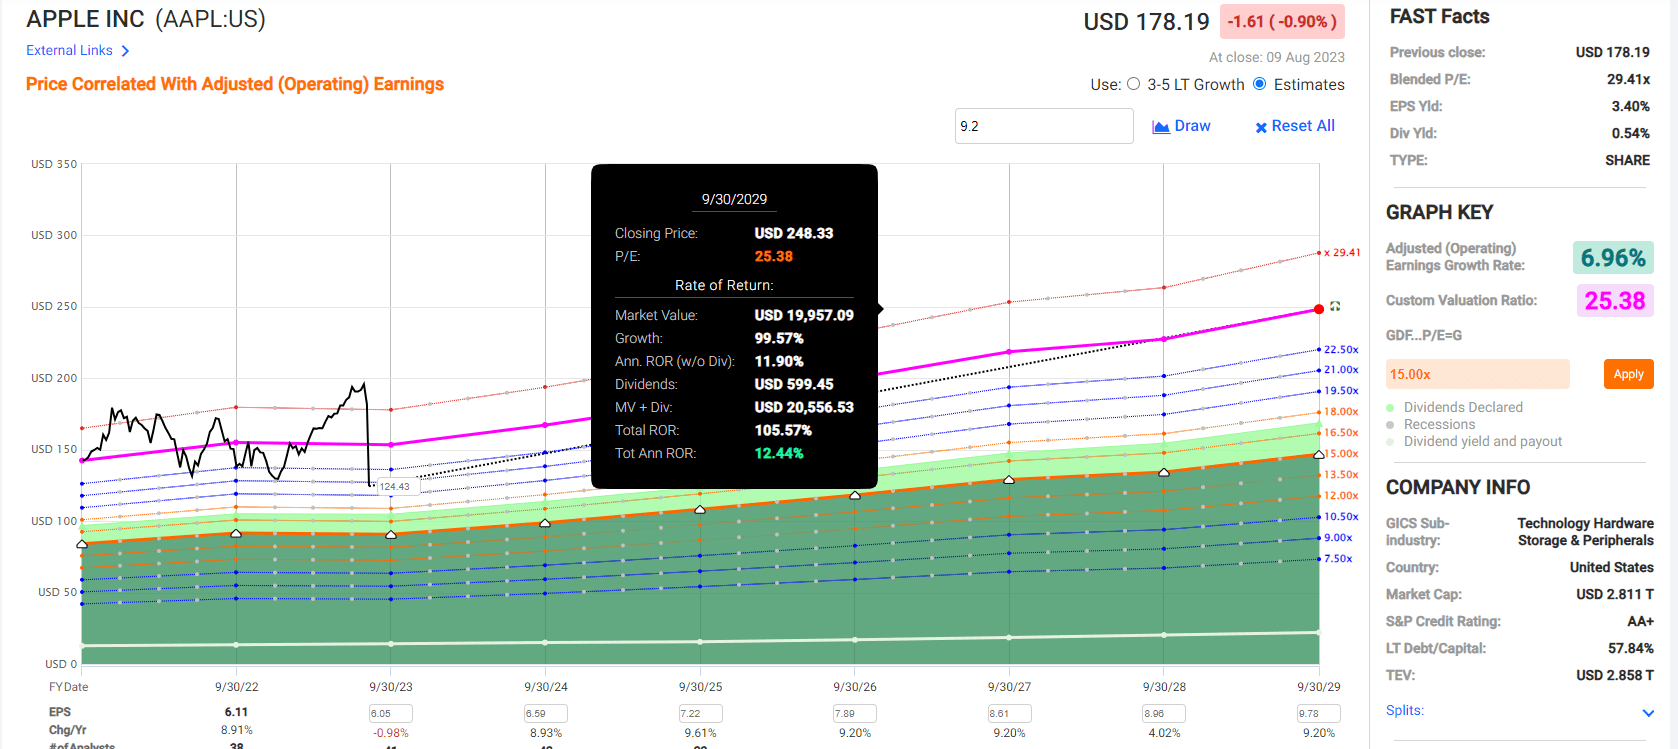
Apple 2029 Consensus Total Return Potential From Fair Value $166
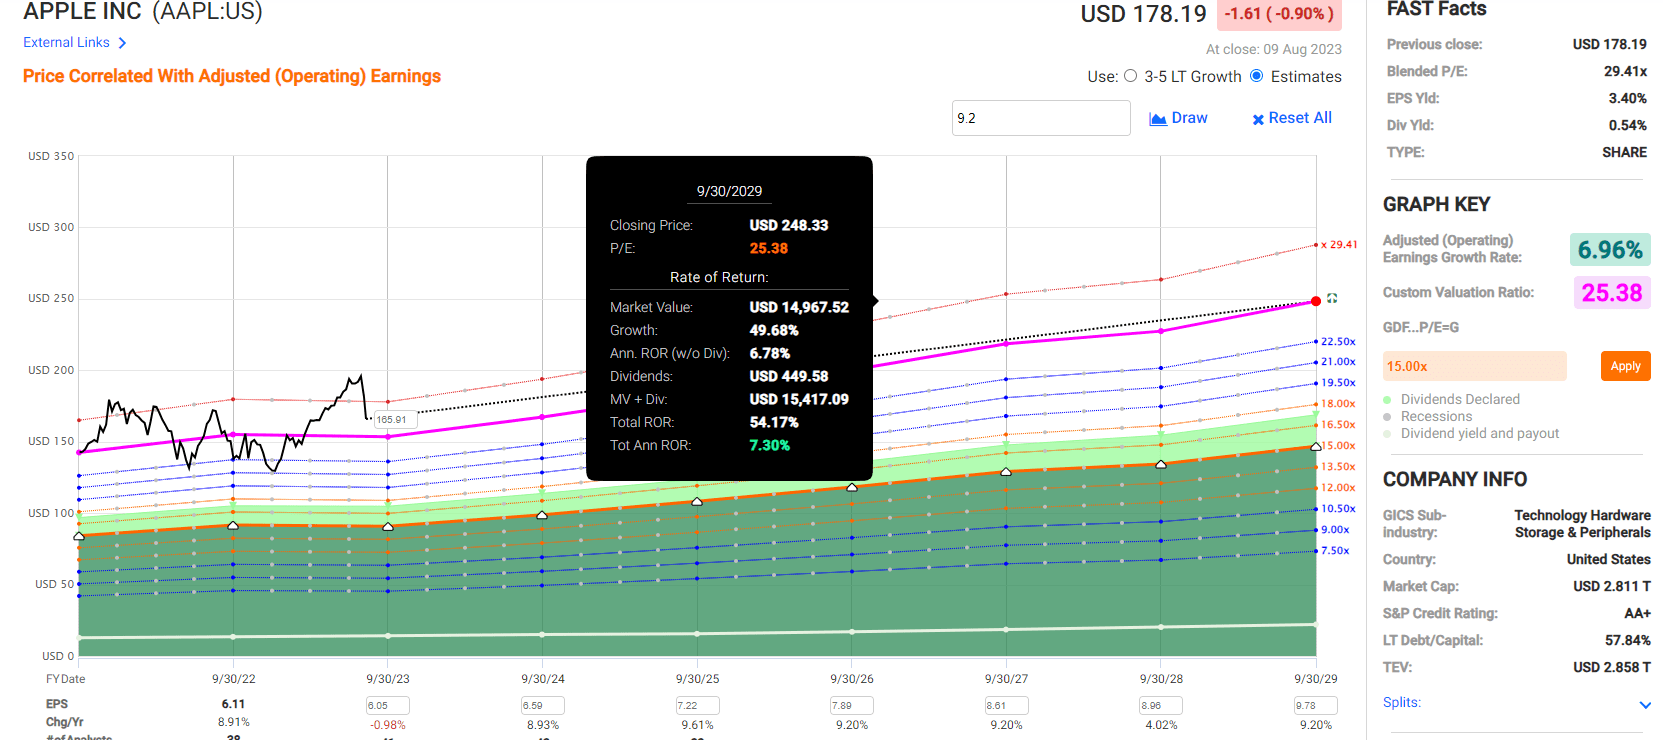
FAST Graphs, FactSet
Buy Apple at its fair value of $166, and you’ll potentially earn an extra 12% over five years. Still not very impressive.
Apple 2029 Consensus Total Return Potential From Good Buy Price $158 (5% discount)
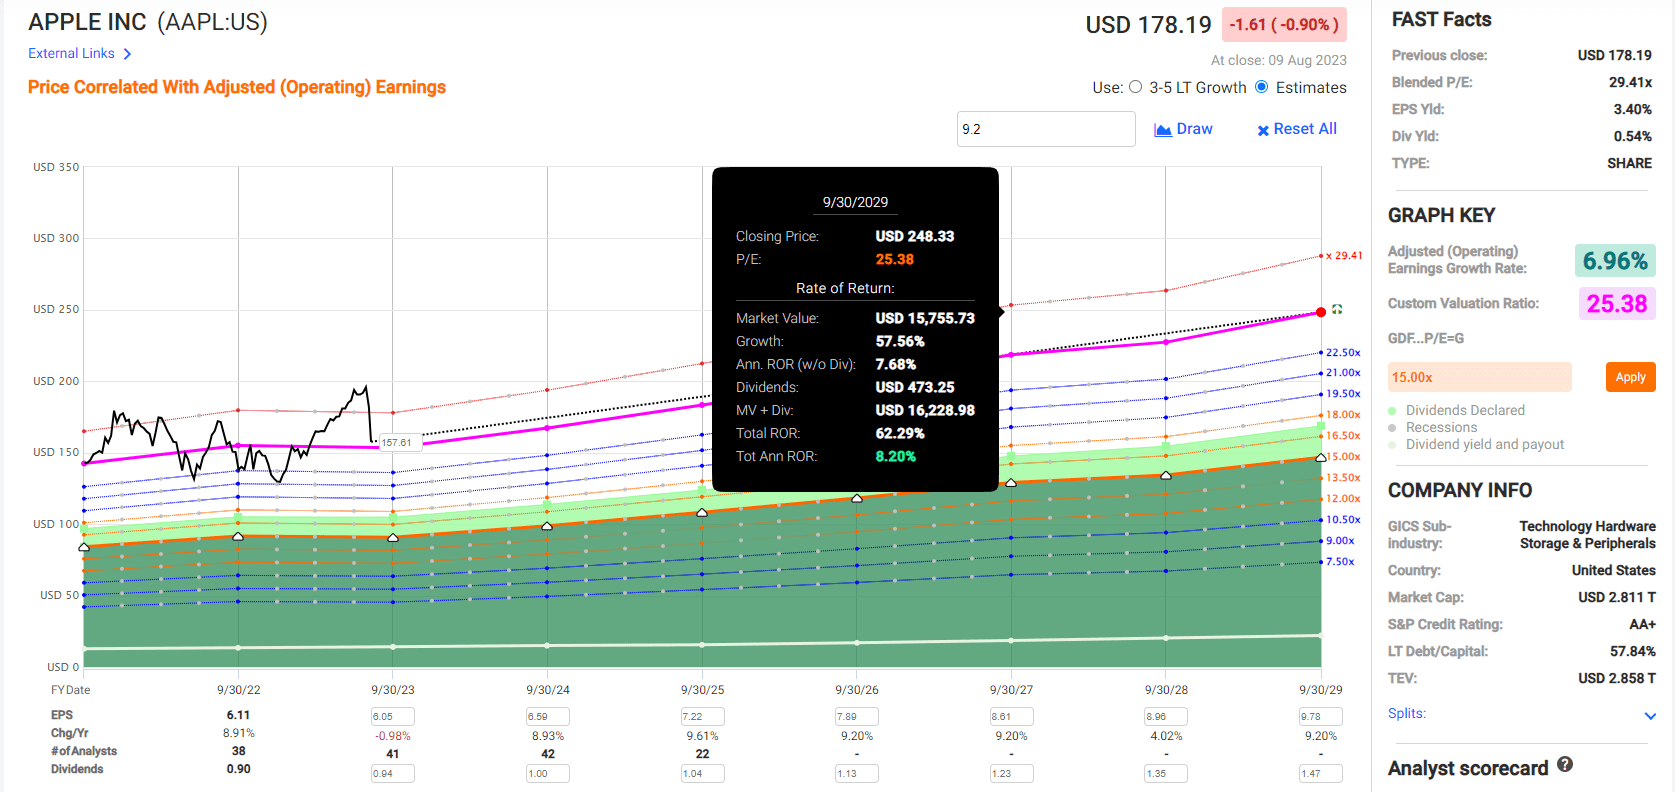
FAST Graphs, FactSet
Buy Apple at a 5% discount, a good price, and you’ll possibly earn 20% more over five years than if you pay a 7% premium today.
That’s 50% better than buying the S&P 500 today, but hardly Buffett-like.
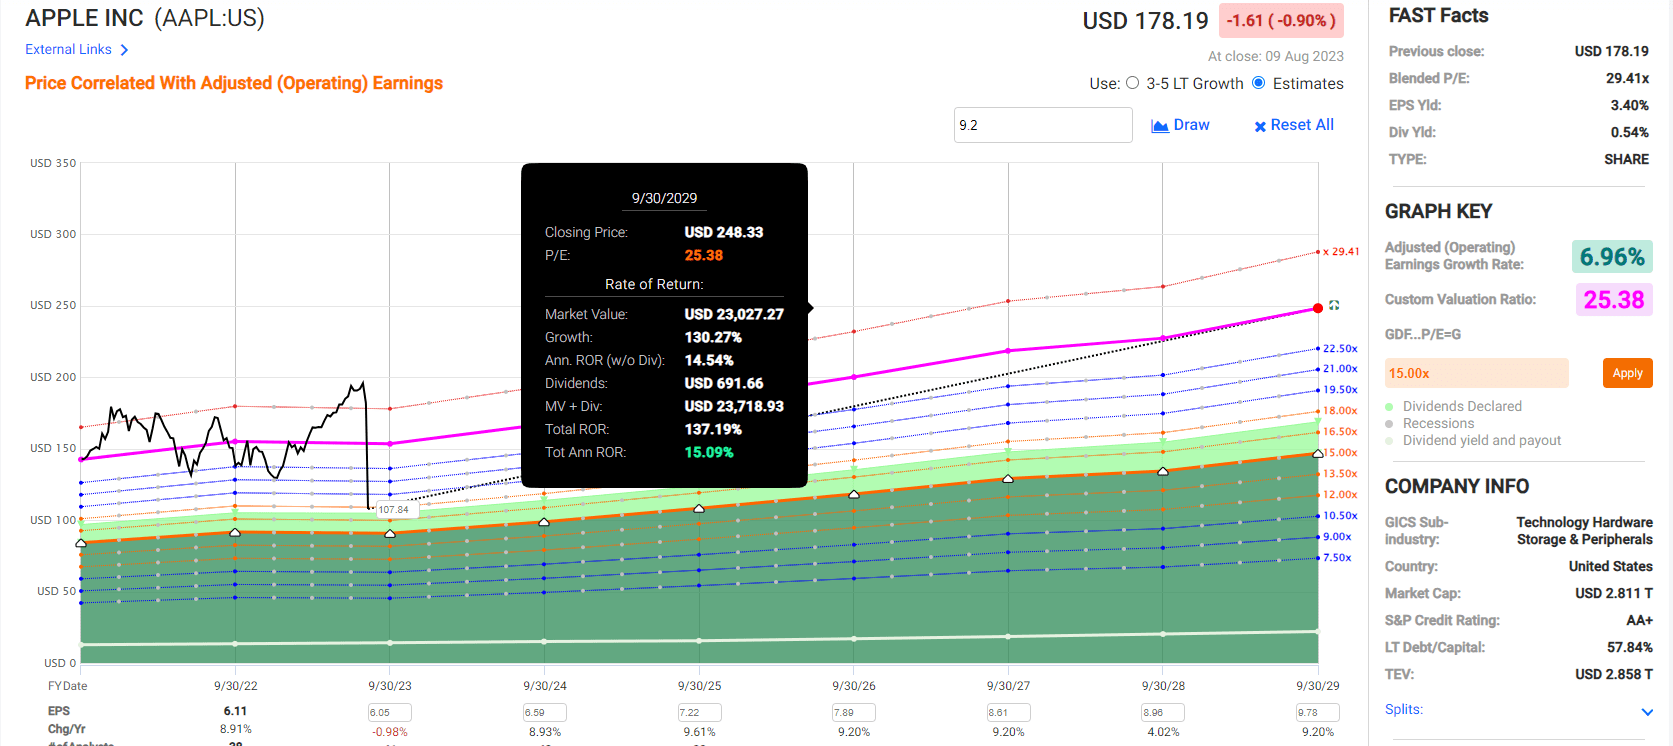
Apple 2029 Consensus Total Return Potential From Strong Buy Price $141 (15% discount)
FAST Graphs, FactSet
At its current consensus growth rate, Apple can only deliver double-digit returns over the next six years if you buy it at a 15% discount.
Note that buying at this 15% discount means you can earn twice the returns as if you paid today’s 7% premium price.
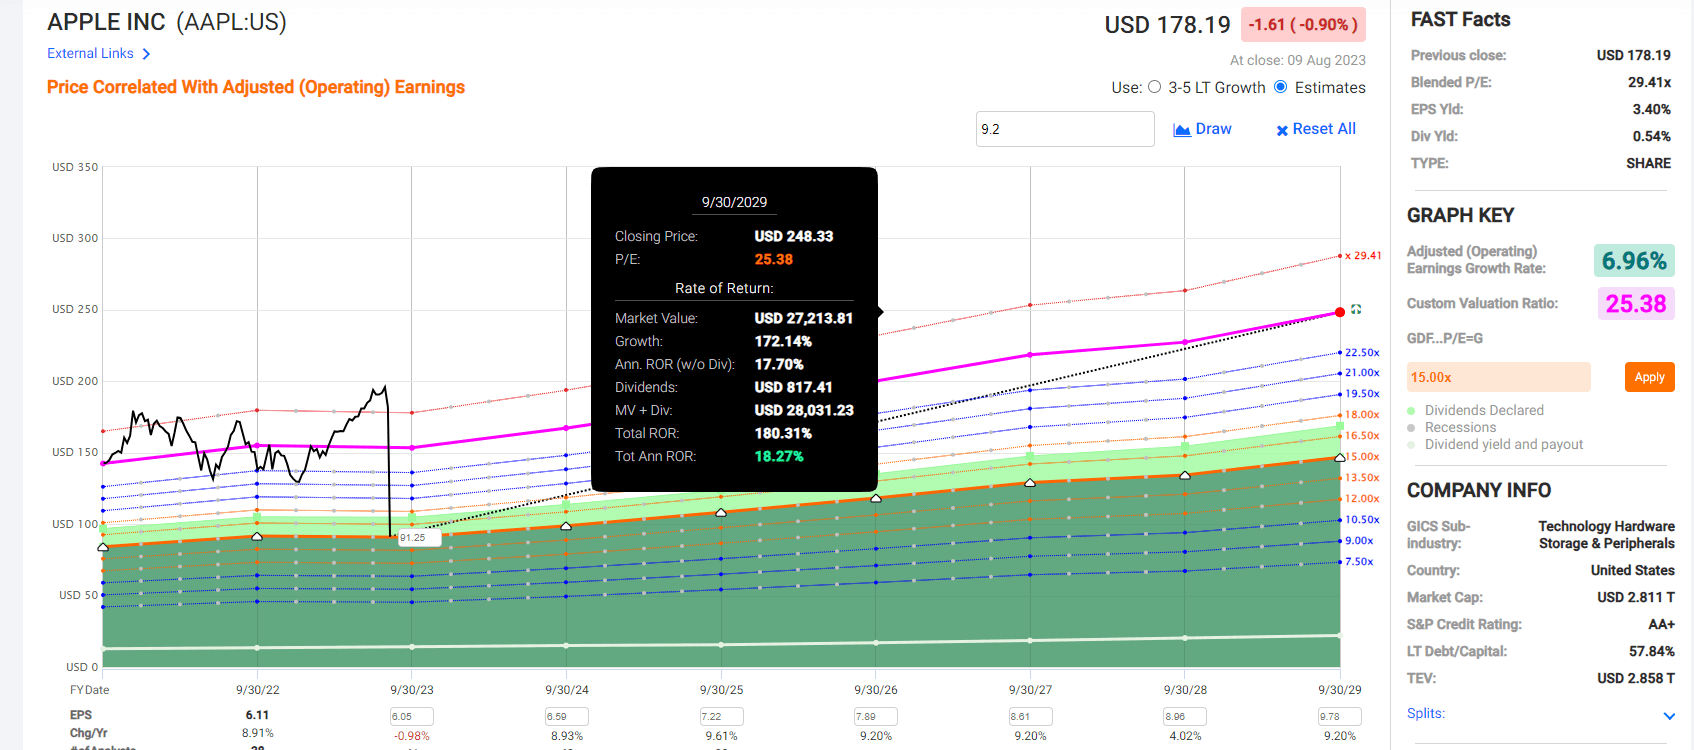
Apple 2029 Consensus Total Return Potential From Very Strong Buy Price $124 (25% discount)
FAST Graphs, FactSet
Remember that the highest price target on Apple is $240 for 12 months from now. In 2029 the consensus fundamentals determined fair value is $248.
If Apple grows at 7%, then in six years, the stock price will be historically worth $248 using objective market-determined fair value.
7% growth is so slow that unless you buy Apple at a 25% discount, you won’t likely be able to double your money in the next six years.
Apple 2029 Consensus Total Return Potential From Ultra Value/Buffett “Fat Pitch” Buy Price $108 (35% discount)
FAST Graphs, FactSet
If you ever get the chance to buy Apple at a 35% discount, don’t wait, pull the trigger. There are few ways to earn 15% annual returns for six years with lower fundamental risk than Apple.
Apple 2029 Consensus Total Return Potential From Mortgage The House Buy Price $91 (45% discount)
FAST Graphs, FactSet
Bottom Line: Apple Isn’t A Buy Yet, But At $124, It Can Earn 20% Annual Buffett Returns For 2 Years
The only way you’ll ever earn Buffett-like returns from Apple is if it figures out a way to double its growth rate… or you buy it at a massive discount of close to 50%.
Or, if you settle for a shorter time frame, you can earn Buffett-like returns at a more modest and realistic discount.
Buy Apple At A 25% Discount ($124), And You Can Earn 20% Returns For 2 Years
FAST Graphs, FactSet
I love Apple products, and the company, and the stock for the long term.
But I’m not going to lie to you and tell you pie-in-the-sky fantasies like what Ben Reitzes or Daniel Ives (second most bullish analyst) are telling you.
Why I’m Confident Apple’s Luxury Brand Isn’t Worth 30+ Earnings Forever
The most valuable luxury brand on earth other than Apple is LVMH.
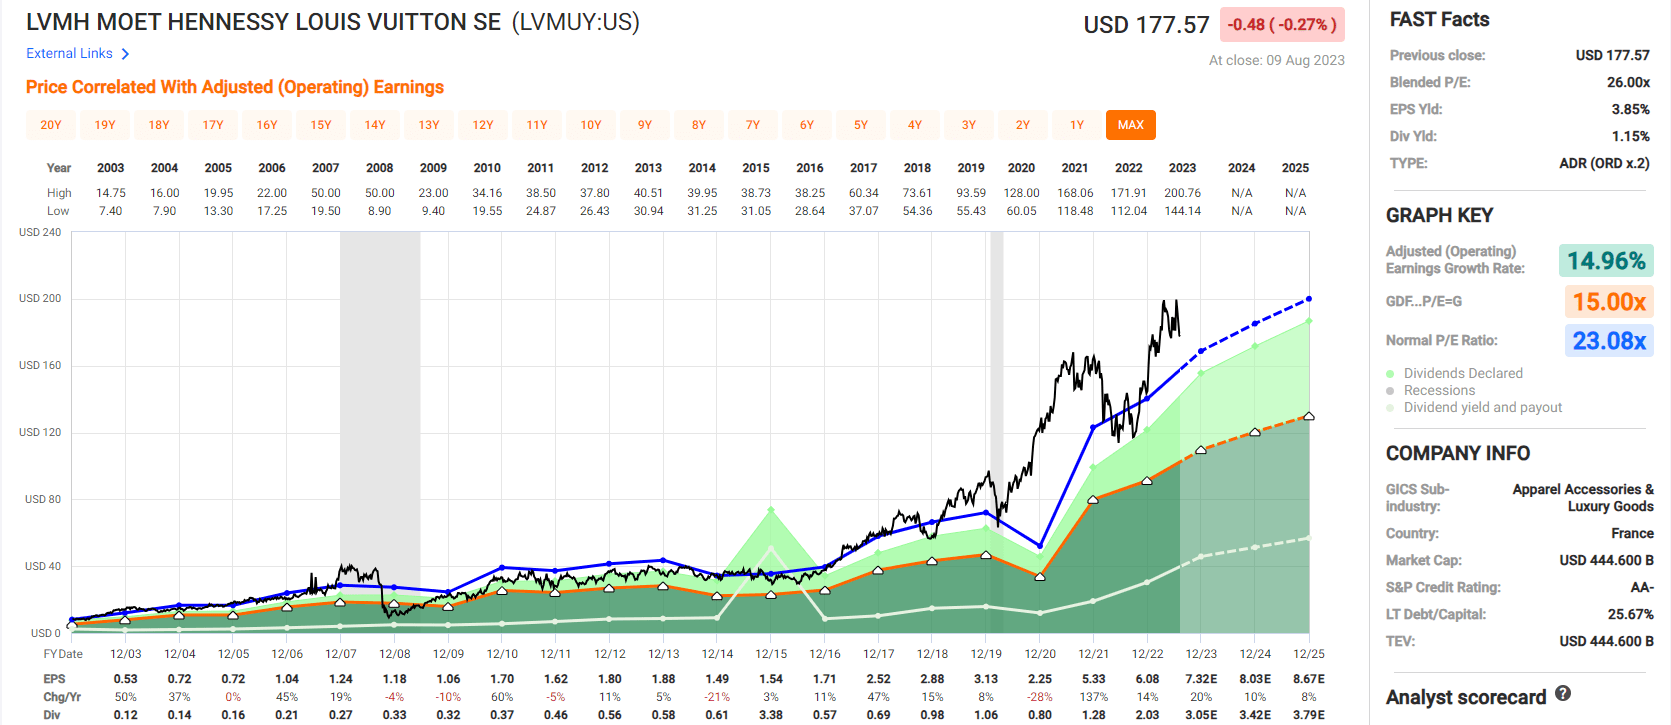
FAST Graphs, FactSet
LVMH has historically grown 15% and has been valued at 23X earnings.
That’s not an opinion. It’s an objective fact. Anyone who paid 23X earnings for LVMH for 20 years fully realized its yield + long-term growth.
According to analysts, LVMH is growing at 12.5% today and is most likely still worth 23X earnings.
Apple is growing 9.2% and has a slightly more stable cash flow but a slower growth rate. So tell me why this tech luxury brand is worth 35X earnings (Wedbush’s Ives) or even 37X (Melius’s Reitzes)?
I’ve watched Ives on Bloomberg. He makes strong points about why Apple is a great company. But he has not explained why Apple’s future fair value PE will be 35 instead of 25.
Anyone who tells you that Apple’s future fair value PE, the PE around which it will cycle and return to across the market cycle, is over 30 might not be wrong.
But they are certainly not supported by any objective historical data.
There are two times in a man’s life he should not speculate. When he can’t afford to, and when he can.” – Mark Twain