

Stocks rallied again on Wednesday with the S&P 500 rising about 70 basis points. The index fell sharply in the final 20 minutes of trading, giving back nearly a third of its gains. More importantly, most of the activity in the market appeared to be driven by volatility supply, with the falling to 17. Interestingly, the closed higher at 14.7, leaving us with front-end volatility rising while volatility further out on the curve was falling.
In fact, the CBOE Volatility Index decomposition tool on the CBOE website shows that the decline in the VIX was partially due to the decline in call skew, indicating that upside call demand weakened materially on the day.

The Volatility SPX Bid Index fell much more sharply than the Volatility SPX Ask Index, indicating that downside volatility was marked down far more aggressively than upside. As a result, skew increased on the day, even though upside call demand weakened. 
This matters because the rally wasn’t driven by traders buying equities; it was driven by traders selling volatility. The aggressive marking-down of downside vol mechanically lifted the index, rather than genuine demand for stocks.
To support this further, constituent volatility fell far (VIXEQ) less than the VIX, confirming that the rally was driven by aggressive selling of index volatility rather than broad-based demand for equities or single-stock vol. This dynamic pushed both the dispersion index and the implied correlations index lower on the day and even caused the spread between the dispersion index and the 3-month implied correlation to contract. Historically, when this spread contracts, the S&P 500 typically declines, making this an important signal to monitor.

This specifically matters because it suggests the rally over the past three days has been driven far more by mechanical factors related to the shortened trading week and volatility selling than by investors actively choosing to get long equities in anticipation of further upside. In fact, the underlying mechanics from yesterday point in the opposite direction with the demand for call-side upside protection actually weakened, reinforcing the view that this was a vol-supply-driven move rather than genuine bullish positioning.
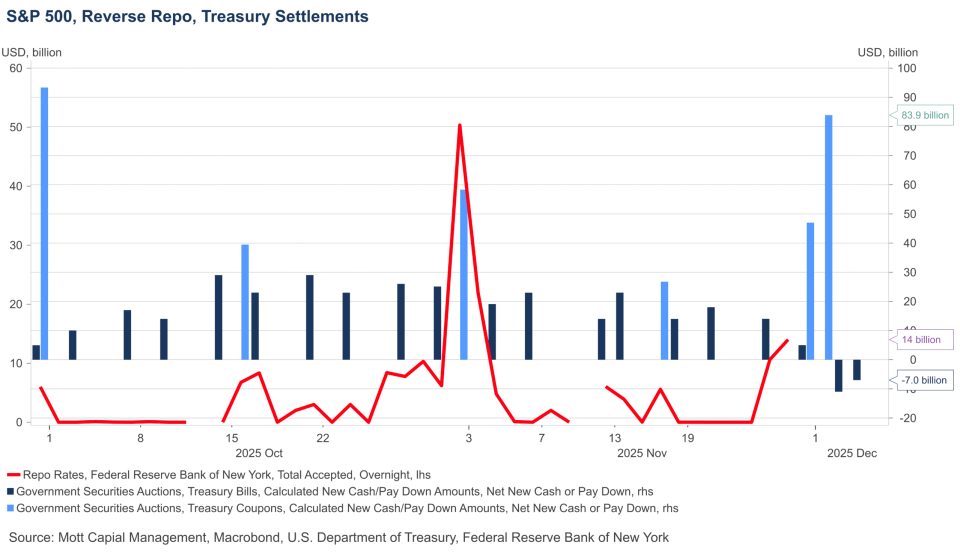
This matters a great deal because the two largest settlement dates of the week are still ahead of us. The biggest will occur on the 28th, when roughly $52 billion of Treasury bills and coupons are set to settle. Then, on December 1st, another $84 billion in coupons will settle. This will be followed by a net paydown of about $11 billion on December 2nd and another $7 billion on December 4th. Even with those paydowns, a substantial amount of liquidity will be drained on Friday and Monday. Combined with the month-end, these flows should tighten overnight funding rates and overall liquidity conditions as both dynamics play out simultaneously.
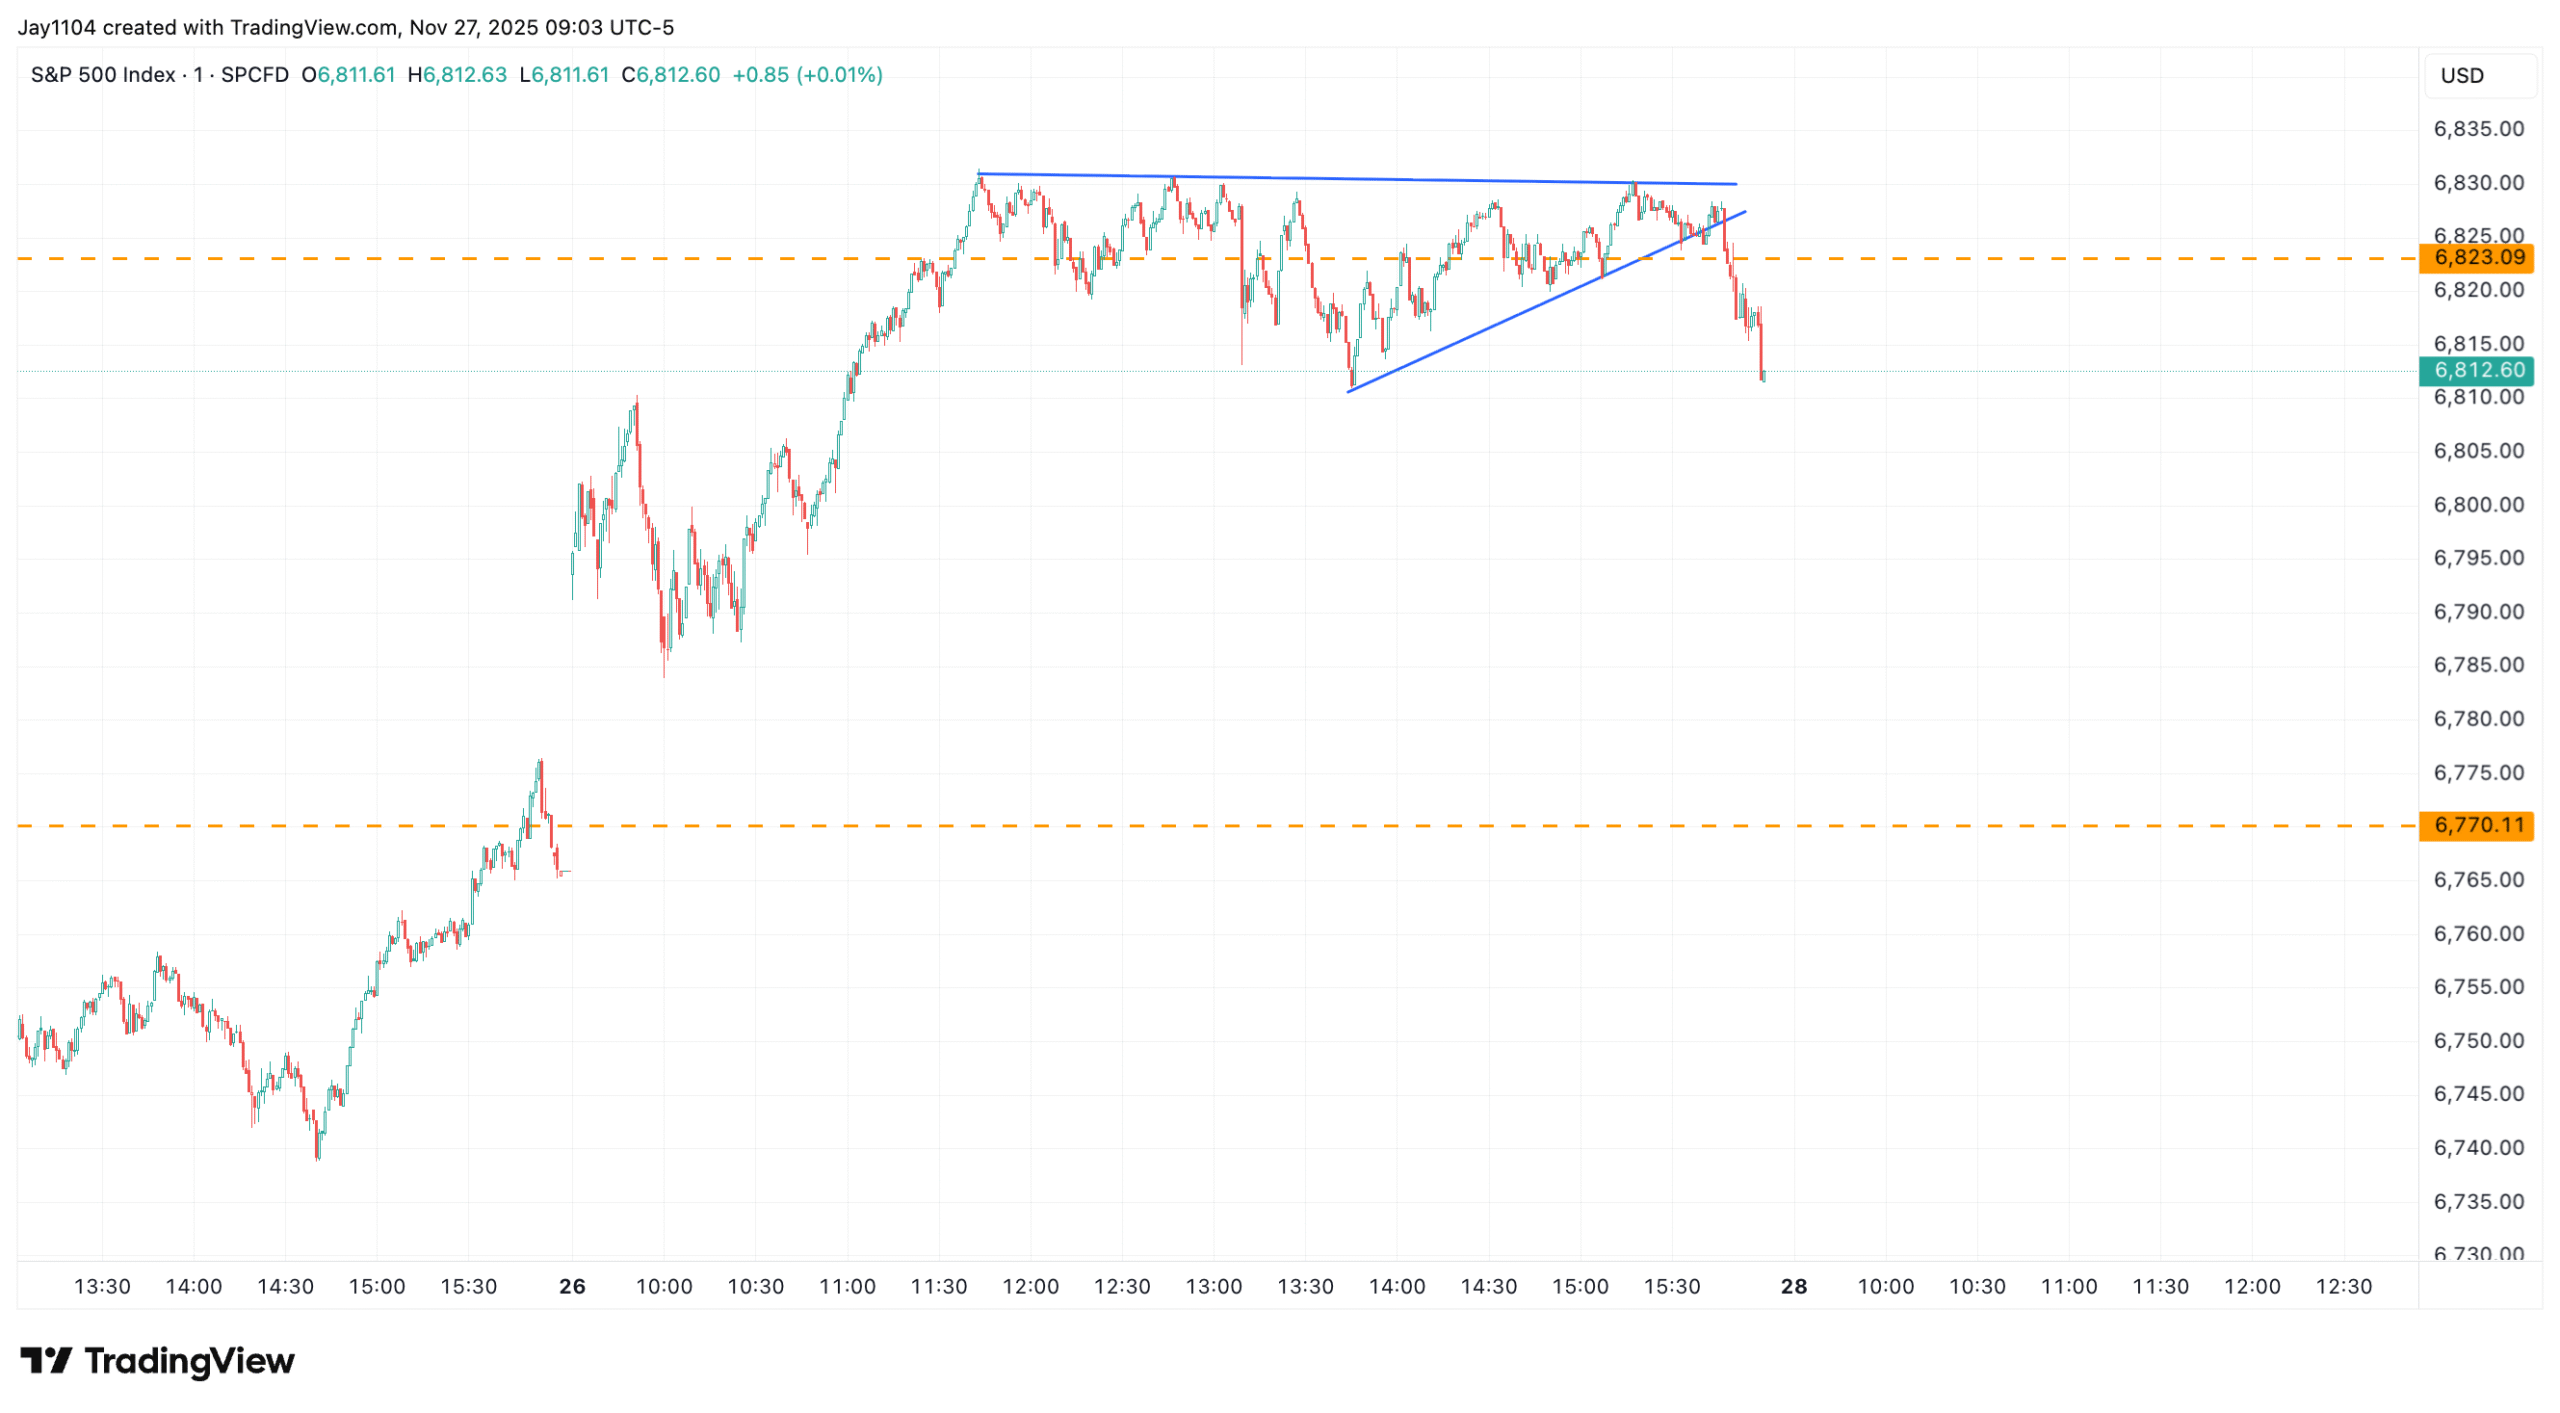
Coupled with a strongly positive gamma setup in the S&P 500, and major gamma resistance zones around 6,850 and 6,900 — we are in an environment where market makers will naturally act as sellers of rallies and buyers of dips. The problem is that if the index slips below 6,800, there is very little support until roughly 6,500, and the gamma-flip zone sits somewhere between 6,750 and 6,800. This means we are very close to flipping back into negative gamma territory should the market begin to weaken at all on Friday or Monday, at a time when liquidity will already be extremely thin. In that scenario, with virtually no support in the marketplace until much lower levels, it is quite possible that a meaningful portion of the past few days’ rally could be retraced quickly if mechanical flows reverse and take control of price action.

Taken together, the last three days of gains look far more like a mechanically driven rally fueled by volatility supply than a genuine expression of bullish conviction. With the largest Treasury settlement flows still ahead on Friday and Monday, liquidity conditions are likely to tighten further, and the gamma landscape remains precariously close to flipping negative. That leaves the index vulnerable to reversal should even modest selling pressure emerge. The bottom line is that the coast is not clear — the most challenging part of the settlement cycle still lies directly in front of us, and we won’t have an accurate read on the market’s true footing until Monday’s session is behind us.
Glossary by ChatGPT
-
Call Skew: A measure of how implied volatility differs between out-of-the-money call options and at-the-money options, reflecting relative demand for upside protection.
-
Constituent Volatility: The implied volatility of individual stocks within an index.
-
Dispersion Index: A metric tracking the difference between index volatility and the average volatility of its components.
-
Gamma: An options Greek that measures how quickly delta changes, influencing how market makers hedge price movements.
-
Gamma Flip Zone: The price region where dealer positioning shifts from positive to negative gamma, altering hedging behavior.
-
Implied Correlations Index: A measure of how closely option markets expect individual stocks in an index to move together.
-
Negative Gamma: A dealer positioning regime where hedging flows amplify market moves rather than dampen them.
-
Skew: The relative pricing of upside versus downside options, indicating where demand is concentrated along the volatility surface.
-
VIX Ask Index: A volatility measure derived from VIX options reflecting pricing on the offer side, often associated with demand for upside volatility.
-
VIX Bid Index: A volatility measure derived from VIX options reflecting pricing on the bid side, often associated with demand for downside volatility.
Disclaimer: This report contains independent commentary to be used for informational and educational purposes only. Michael Kramer is a member and investment adviser representative with Mott Capital Management. Mr. Kramer is not affiliated with this company and does not serve on the board of any related company that issued this stock. All opinions and analyses presented by Michael Kramer in this analysis or market report are solely Michael Kramer’s views.