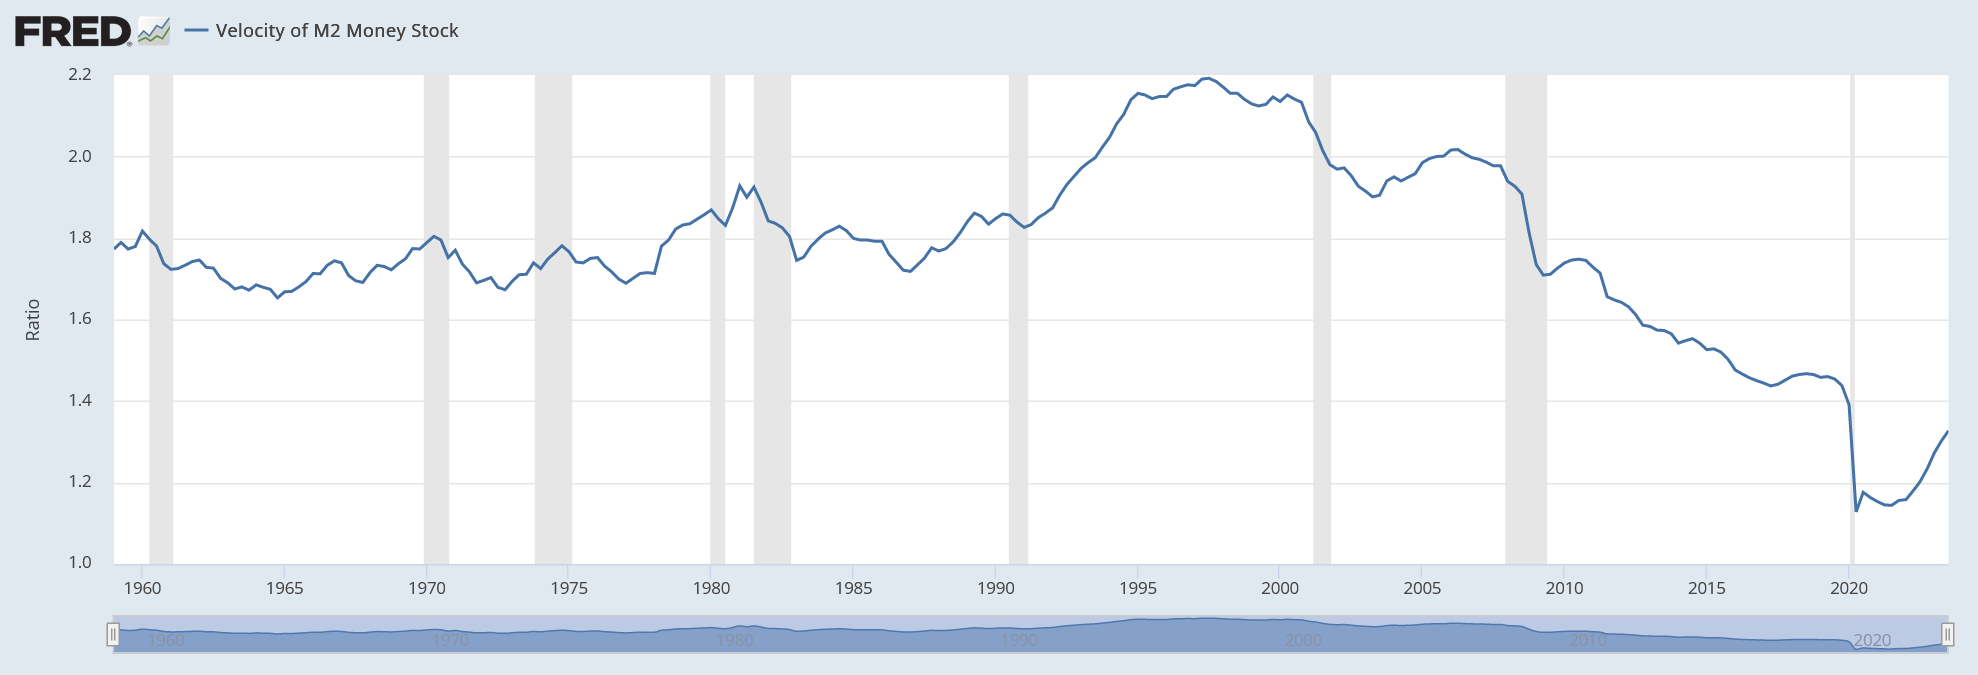
Now that we have our first estimate of for Q3, we also have our first estimate of M2 velocity for the third quarter. Because there is an amazing amount of uninformed hypothesis out there, I figured it was worth a quick review of where we are and where we’re going, and why it matters.
Why it matters: without the rebound in velocity, the slow-but-steady decline in M2 that we have experienced since mid-2022 would be outright deflationary. The money decline and the velocity re-acceleration are part and parcel of the same event, and that is the geyser of money that was squirted into the economy during COVID.
Velocity collapsed for mostly mechanical reasons: it is a plug number in MVºPQ, and since prices do not instantly adjust to the new money supply float, velocity must decline to balance the equation. Another way of looking at it is that if you add money to people’s accounts faster than they can spend it then velocity will decline.
I have previously presented an analogy that in this unique circumstance money velocity behaves as if it were a spring connecting a car, speeding away suddenly, with a trailer that has some inertia. Initially the spring absorbs the potential energy, and later provides it to the trailer as it catches up. Ultimately, the spring returns to its original length, when the car has stopped accelerating and the trailer is going at the same speed.
As M2 has declined in an unprecedented way, after surging in an unprecedented way, velocity has rebounded in an unprecedented way after plunging in an unprecedented way. All of these things are connected, episodically (but we will look at the underlying, lasting dynamics in a bit).
With this latest GDP update, M2 velocity rose 1.9%, the 9th largest quarterly jump since 1970. Over the last four quarters, it has risen 10.4%, the largest on record, and 16% over eight quarters, also the largest on record.

Note that there is no way we get the price level back to where it was, unless M2 declines considerably farther for considerably longer, or unless money velocity inexplicably turns around and dives again. I know that some well-known bond bull portfolio managers have been calling for that, but they were wrong the whole way along so why would you listen to them now?
I’ve been pretty clear that (a) I have been surprised that the Fed was successful in decreasing the money supply, since I thought the elasticity of loan supply would be more than the elasticity of loan demand (I was wrong), (b) I think the Fed deserves credit for shrinking the balance sheet, which they have long said doesn’t matter (it matters far more than interest rates, for inflation), (c) Powell deserves credit for turning into a hawk and pushing the institution of the Federal Reserve to become hawkish after decades under Greenspan, Bernanke, and Yellen where the only question being asked was ‘do we wait for the stock market to drop 10%, or only 5%, before we flood the system with money?’
Chairman Powell deservedly will go down in history as the guy who recognized the ‘spring effect’ that kept long-term upward pressure on inflation even as so many people were chirping about supply constraints and ‘transitory inflation’ (including, to be fair, Powell himself. But whatever he said, what he did was pretty reasonable).
However, the next bit is going to be challenging.
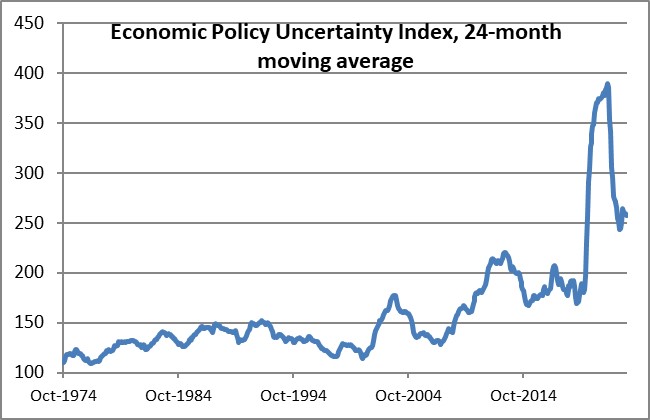
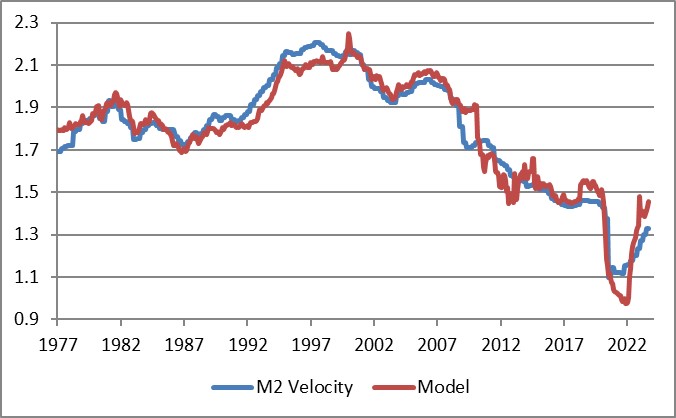
Velocity, being the inverse of the demand for real cash balances, is primarily affected by two main forces – one of them durable and one of them ephemeral. The ephemeral effect, which is rarely super-important, is that people tend to want to hold more cash when they are uncertain. Indeed, our model for velocity actually captured accidentally some of the ‘spring effect’ because for us it showed up as extreme uncertainty.
Put another way, even if the Fed hadn’t flushed tons of money into the system, velocity would have had something of a sharp decline because of the high degree of economic uncertainty. Ergo, it was crucial that they flush in at least some money because otherwise we would have had outright deflation. They didn’t get the magnitude right, but they got the sign right. Anyway, the ‘uncertainty’ effect doesn’t last forever.
The measure of uncertainty I use is a news-based index of economic policy uncertainty; it has retraced about 85% of its spike although it has been persistently high since political divisiveness became the main fact of US political life back in 2009 or so.
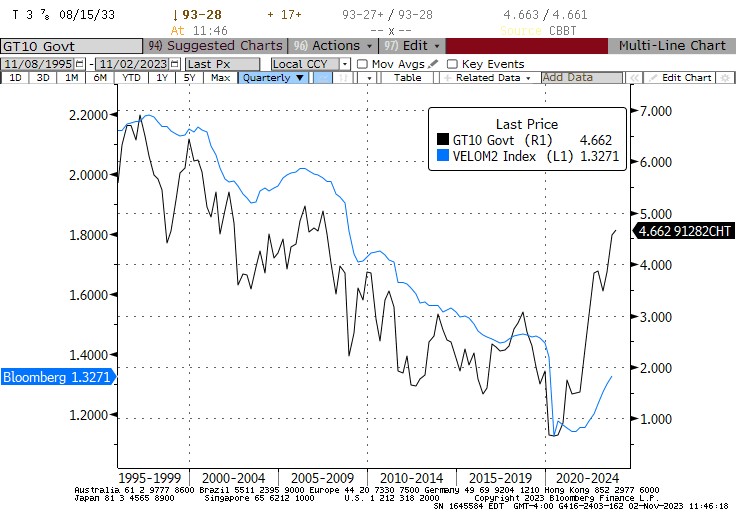
The more durable effect on the desire to hold cash is the presence of better-yielding alternatives to cash. When interest rates are uniformly zero and the stock market is on the moon, there’s very little reason to not hold cash. But when non-cash rates are high, and stocks and other investments more reasonably priced, cash is a wasting asset that people want to ‘put to work.’ The easiest way to see that is with interest rates, which for the last couple of decades have tracked the decline in money velocity closely as both declined.
And here is the problem. If interest rates are back at 2007 levels, then naïvely we would expect velocity to be back in the vicinity of 2007 levels also. But that is massively higher than the current level. In 2007, money velocity was around 1.98 or so: about 49% higher than the current level!
Needless to say, there’s no way the money supply is contracting that much. If velocity rose even, say, 30% then we would have a serious and long-lasting inflation problem. Fortunately, because of the economic policy uncertainty and other non-interest rate effects (I did say that “naïvely” we would be looking for 1.98, right?), the eventual rise in velocity beyond the snap-back level is much less than that. It actually only adds about 6% to the snap-back level. That still means 2% more inflation than would otherwise be expected, for three years, or 3% more for two years.
Of course, interest rates could fall again and ‘fix’ that problem. But it’s hard to see that happening while the money supply continues to contract, isn’t it? And that’s where it gets difficult. If you continue to decrease the balance sheet – which you need to do – and money continues to contract, then you probably get more velocity and inflation stays higher than you expect. Or, if you drop interest rates then you don’t get velocity much over the pre-COVID level, but you also get more money growth and inflation stays higher than you expect.
All of which adds up to one reason why I continue to think that inflation will stay sticky and higher than we want it, for a while. Powell has surprised me before, though, and this would be a good time to do it again.


