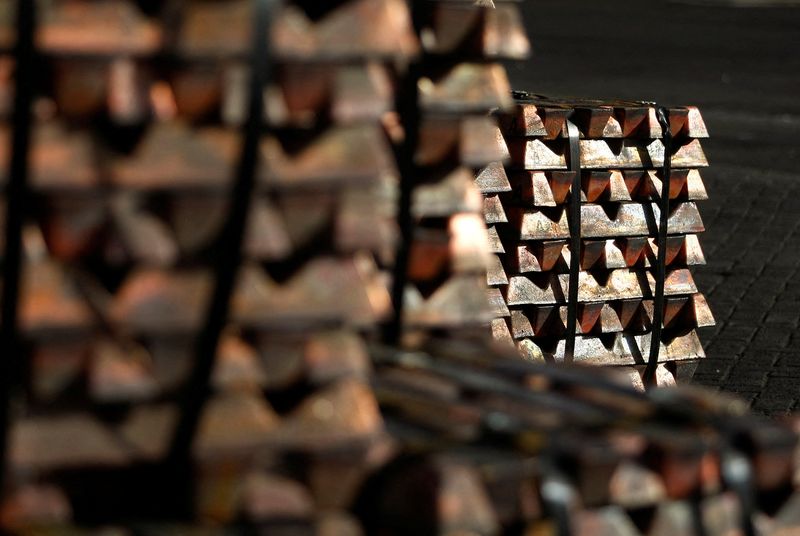
LONDON (Reuters) – Copper surged to record highs on Monday as a recent rally triggered by short covering created momentum for speculators and funds to bet on higher prices of the metal.
Below are the main facts about the market, sourced from the International Copper Study Group (ICSG), the International Copper Association (ICA), and Reuters data.
INDUSTRIAL USES
Copper is used in the power and construction industries and is widely expected to benefit in future from the green energy transition via additional demand from the electric vehicle sector and new applications including data centers for artificial intelligence (AI).
Equipment manufacturing is currently the largest end-use sector for copper, followed by construction and infrastructure.
Global apparent use of refined copper rose from 10 million metric tons in the late 1980s to 26.5 million tons in 2023 as Asia became the largest consumer with a 70% share of consumption. As of 2022, China was the largest consumer of refined copper with usage of 14.7 million tons.
PRODUCTION CHAIN BY TYPE AND BY REGION
Deposits of copper, one of the first metals used by humans, are widespread around the globe. Scrap accounts for significant amounts of global supply annually.
Copper’s primary production chain starts from the mining of copper-bearing ores, then moves to production of copper concentrates typically containing around 30% copper.
The smelting process transforms concentrate into a matte containing 50-70% copper. The matte is processed into a blister copper of 98.5-99.5% copper content. In the next step, refined cathodes are produced with 99.99% copper content.
Copper mine production totalled 22.4 million tons in 2023, with Chile, Peru and Democratic Republic of Congo (DRC) being the largest producers. Production of refined copper, including secondary or scrap, totalled 26.5 million tons in 2023, with China being the largest producer.
MAJOR EXPORTERS AND IMPORTERS
Global copper trade includes all major products in the processing chain – concentrates, blister and anode, cathode and ingots, scrap and semi-fabricated products.
Chile, Peru and Indonesia are major exporters of copper ores and concentrates, while China, Japan and South Korea are major importers of these products.
In the market for copper blister and anode, Zambia, Chile and DRC are major exporters, with China and India being major importers.
For the refined copper trade, Chile, DRC and Russia are major exporters, while China, the U.S. and Italy are major importers.
SUPPLY-DEMAND BALANCE
The global 26.5 million-ton refined copper market was balanced in 2023, but faces a surplus of 162,000 metric tons this year and 94,000 tons in 2025, according to the ICSG, as refined production is forecast to rise by 2.8% in 2024 and 2.2% in 2025.
However, the supply of copper from mines has been lower than expected so far this year due to the slower ramp-up of a number of projects, delays in new projects and the December closure of First Quantum (NASDAQ:)’s major Cobre Panama mine.

This has tightened the supply of copper concentrate to smelters in China and is visible in collapsing refining and treatment charges (TCs) in the country.
Despite tight supply of copper concentrate, current demand for copper in China is relatively weak as inventories in warehouses monitored by the Shanghai Futures Exchange are near four-year highs and the premium to import copper into China’s Yangshan area is at zero.

