We’ve discussed before that country classification isn’t as easy as you might think. That’s especially true for companies with operations that cross borders.
Index providers often use a combination of country of incorporation, headquarters and primary listing to determine a company’s “home” country. If that’s not clear, tiebreakers include where staff, management, assets and revenues are.
Today, we show that even within the U.S., company location factors can vary quite a bit. Specifically, we show that the location of headquarters (HQ) and incorporation of companies varies significantly, even when both are within the United States.
U.S. companies are domiciled all across the country
For example, Chart 1 shows the headquarters location of the nearly 3,000 companies in the Nasdaq U.S. BenchmarkTM (NQUSB™) Index at the end of 2023. We can see that they are headquartered all over the U.S.
We also show company size (float market cap) with the circle size. The dark blue circles show the largest companies (with more than 50bps weight).
We see a little bit of concentration in the largest companies, with many in the states of California, Washington, New Jersey, New York and Texas – although other states are also home to very large U.S. companies.
Chart 1: Locations of headquarters for companies in the Nasdaq U.S. BenchmarkTM

Some regions specialize more in different sectors
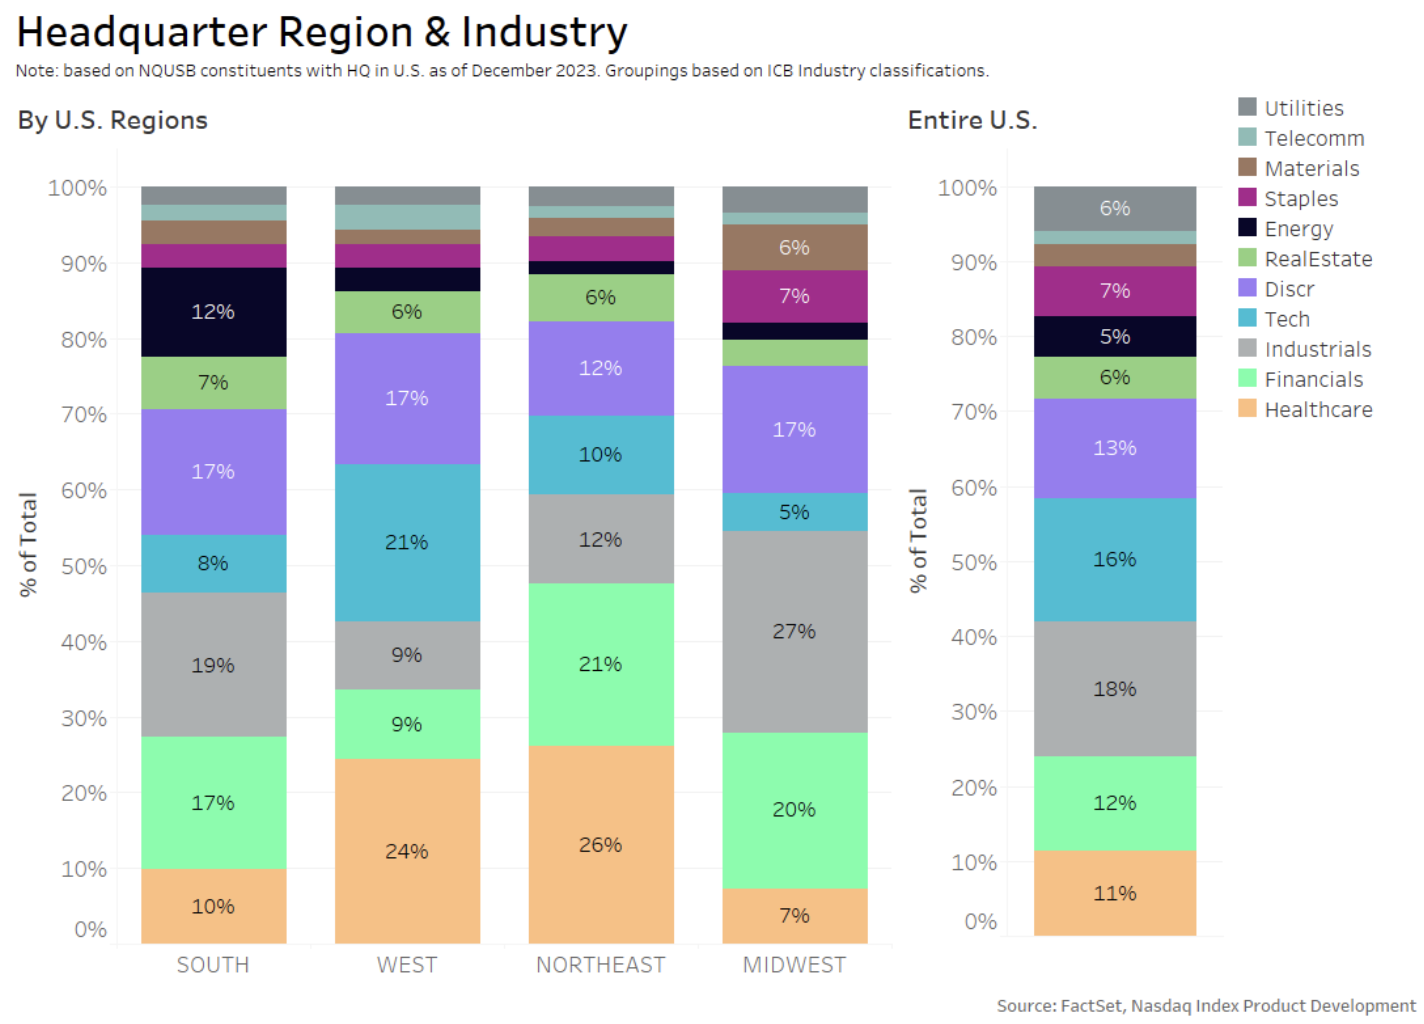
Using the same data, but instead grouping by regions, we see that some regions specialize in one sector more than others. For example, there are:
- More Technology companies in the West (e.g., AAPL, MSFT, NVDA, GOOG/L META).
- More Industrials companies in the Midwest (e.g., UNP, GE, DE, SHW).
- Financials in the Northeast (e.g., JPM, SPGI, GS, MS, BLK, C) & Midwest (BRK, PGR, CME).
- Healthcare in the Northeast (e.g., JNJ, MRK, TMO, PFE) & West (e.g. AMGN, ISRG, GILD).
Chart 2: Distribution of companies by industry and region

The chart above uses ICB Industry classifications for the nearly 3,000 companies in the Nasdaq U.S. Benchmark. Interestingly, there is a nearly even split of companies in the South, West and Northeast.
Incorporation data is completely different, and concentrated
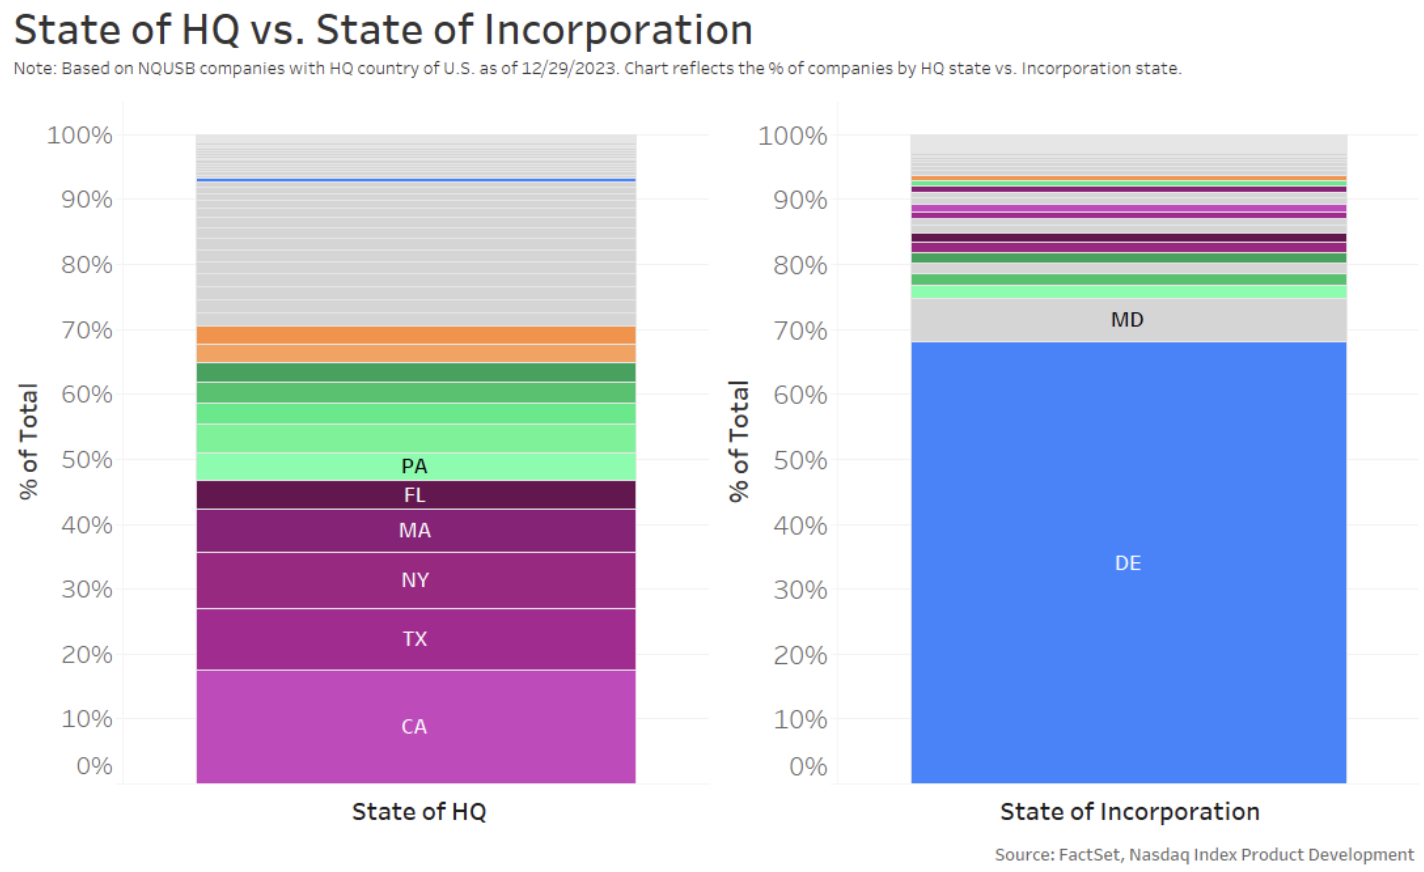
Interestingly, when we look at incorporation, the data tells a very different (and concentrated) story. Around 65% of all companies are incorporated in Delaware, which is known for its business-friendly tax, legal and regulation policies as well as its established corporate court system (Chart 3). Despite being headquartered further away, a much higher 77% of companies from the West are incorporated in Delaware.
Chart 3: Company HQ state vs. incorporation state

Why this matters
Once again, we see that incorporation might not be the best guide for where a company’s “home” really is, even for a company that is clearly “American.”
These results also have important implications for how “home bias” works. Investors think stocks like AAPL and MSFT are just as “American” as JNJ, JPM and XOM – even though some are located thousands of miles apart.
But that helps make the U.S. a larger single market, with more diverse companies, that are all able to be traded and settled at the same time. This, in turn, helps the U.S. market ecosystem support deeper liquidity and cheaper trading.

