BraunS/E+ via Getty Images
Thesis
The current high valuations of tech stocks compared to commodities stocks is aptly highlighted by the fact that Apple Inc. (NASDAQ:AAPL) has a market capitalization that is around double that of the 100 largest mining stocks. The 100 largest mining stocks have a combined market capitalization of at most $1.8 trillion, while Apple has a market capitalization of around $3.0 trillion. This is curious given the fact that these mining companies are much more important to the global economy than Apple, and trade at much lower valuations. I outline numerous reasons for why this may be the case below with the main reason being that Apple is at the peak of its cycle, while mining stocks are close to the trough of their cycle. This means that Apple is priced for perfection, and will consequently likely underperform moving forward. Therefore I rate Apple as a sell.
Overview
Much has been made of the fact that Tesla (TSLA) has a larger market capitalization than most of the other automakers combined, which is attributed to it being a meme stock. However, a less noticed fact is that IT related stocks are currently so highly valued compared to natural resource stocks that the world’s largest company by market capitalization, Apple, is worth significantly more than the market capitalization of the 100 largest mining companies combined. This is curious given the fact that if these mining companies and their assets were to disappear overnight, Apple, as well as the world economy in general would be in deep trouble. The reverse is not true, as there are many other electronics companies producing smartphones, computers and tablets that could fill the void if Apple were to disappear overnight. This article will look into the reasons why Apple commands such a high valuation, and whether it makes sense for it to trade at such a high premium moving forward.
One potential reason why Apple has become the largest stock in the world is due to the popularity of its iPhones. iPhones account for over half of Apple’s revenues, and all hardware accounts for around 80% of revenues, with services accounting for the remaining 20% (see table below). Apple moving towards generating a higher percentage of its revenue from services has also been cited as a reason for its high valuation. Interestingly, this is not yet borne out in the data, as service revenues have not grown significantly faster the overall revenues in the last few years. The impressive increase in its revenues over the last few years is another reason cited for Apple’s high valuation. However, it is so far unclear whether this is a permanent increase or instead a temporary bounce due to the huge stimulus packages passed during the COVID pandemic.
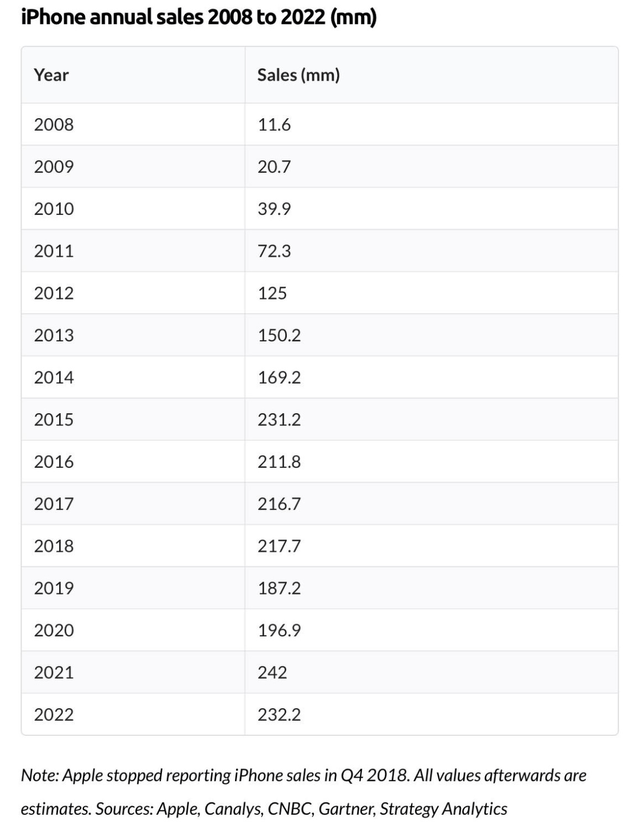
In order to more accurately examine Apple’s future prospects, it is useful to look at Apple’s growth over a longer time period. Apple stopped reporting unit sales of its main iPhone product several years ago, which coincided with a slowdown in unit sales that year. However, third party estimates show that iPhone sales were essentially flat between 2015 and 2022 (see table below). Apple could potentially offset the resulting revenue stagnation by charging even higher prices for its products. However, given that there are competitive alternatives in the market, this would likely result in competitors gaining market share. This means that it is unlikely that Apple’s revenues will increase faster than revenues of the overall stock market in the long run.
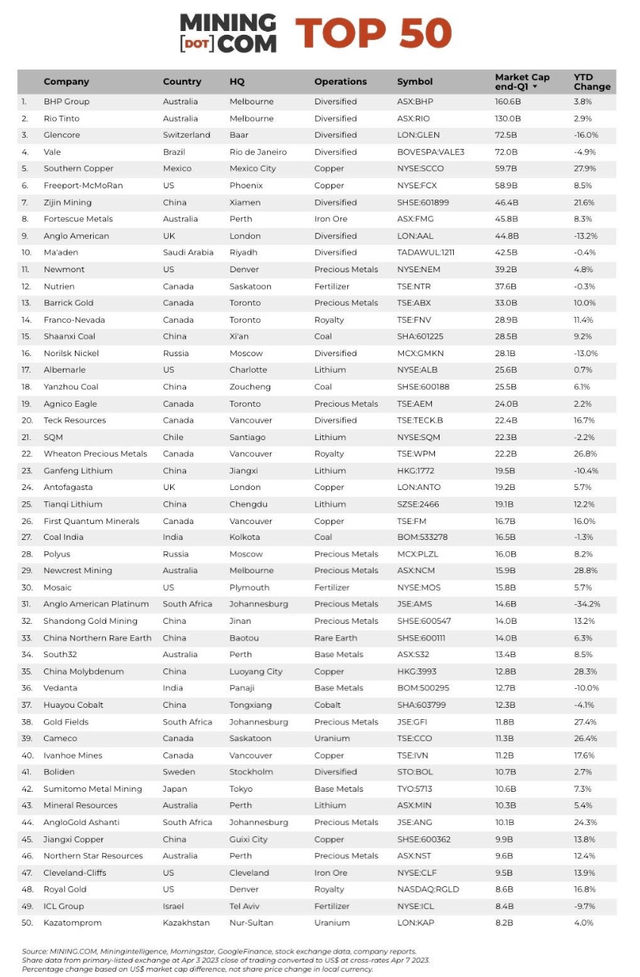
The 50 largest mining stocks (listed below), provide most of the metals Apple needs to manufacture it products. Metals prices have been fairly flat in the last decade, which has been beneficial to Apple, as it has helped increase its profit margin. However, if metal prices were to rise moving forward, this would decrease Apple’s profit margin, while increasing the profit margin of the mining companies. The 10 largest miners are all focused on non-precious metals and are big producers of iron ore and base metals. Just four companies, BHP Group (BHP), Rio Tinto (RIO), Vale (VALE) and Fortescue Metals (OTCQX:FSUMF) produced over 1 billion tons of iron ore in 2021, which is around 40% of all iron ore produced that year. The top 50 stocks had a combined market capitalization of around $1.4 trillion as of April 3, 2023. Given that the 50th ranked company had a market capitalization of $8.2 billion, the market capitalization of the companies ranked 51-100 is at most $410 billion (50*8.2) and likely much less. This means the combined market capitalization of the top 100 mining stocks was at most $1.8 trillion on April 3, 2023.
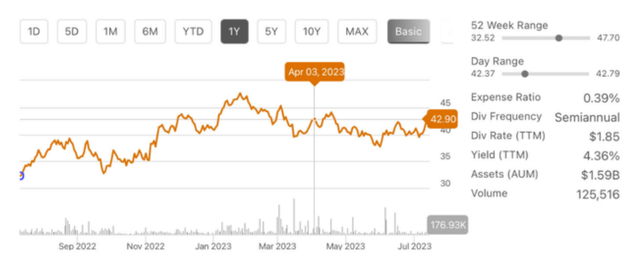
It would be ideal if there was an ETF that held these mining stocks, so that the valuation of this ETF could be compared to Apple’s valuation. Unfortunately, though such an ETF does not exist. The iShares MSCI Global Metals & Mining Producers ETF (PICK) is the ETF that comes closest to replicating an investment in the 100 largest mining stocks, as it includes all mining stocks except those mining primarily gold and silver. Precious metals focused companies account for a relatively small percentage of the market capitalization of the top 100 mining stocks and can be represented by an ETF such as VanEck Gold Miners ETF (GDX). Therefore, PICK would be the best proxy for comparing Apple to the top 100 mining stocks, with potentially a small amount of GDX included as well. The share price of PICK has been relatively flat since April 3, 2023 (see chart below), which means the market capitalization of the top 100 mining stocks is likely still at most $1.8 trillion today. By comparison Apple’s market capitalization is around $3.0 trillion. This means that Apple’s market capitalization is almost twice as high as that of the top 100 mining stocks.
Company Financials
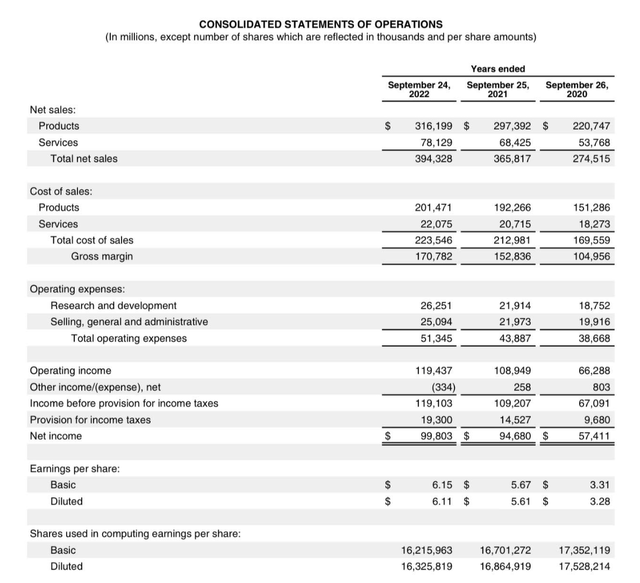
A top reason cited for Apple’s premium valuation is that it is a great business with fantastic financials. Apple is able to charge a substantial premium for their products, resulting in around 25% of revenues flowing down to after tax income (see table below). The recent net income to net revenue percentages were 21%, 26% and 25% for 2020, 2021 and 2022 respectively. This means that despite a large increase in costs between 2020 and 2022, revenues grew even faster, resulting in a sales margin expansion. However, given that the large COVID stimulus packages played a part of this margin expansion, it is unclear whether these high margins are sustainable moving forward. Dividing Apple’s $3 trillion market cap by net income of $99.8 billion gives a P/E ratio of around 30.
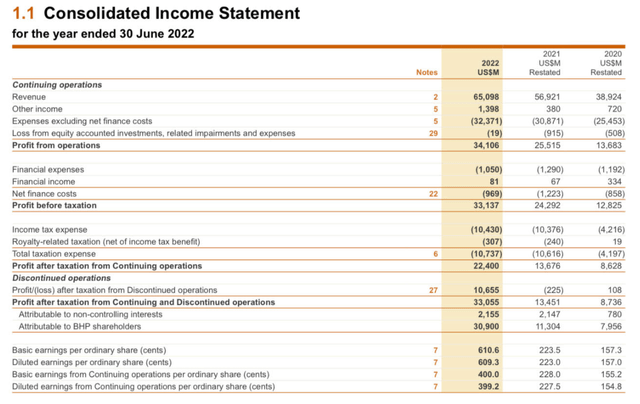
Apple’s valuation is much higher than that of the world’s largest mining stock BHP Group, which provides a good example of the financials of a typical mining stock. Also see my article here for a more detailed look at BHP. One reason cited for assigning lower valuations to mining stocks is the cyclical nature of the mining business. Indeed, looking at BHP’s income statement (see below), its after tax profits has almost quadrupled from 2020 to 2022, which compares to a less than doubling of Apple’s profits over a similar time period. However, interestingly BHP was profitable through this entire time period, including during the COVID recession. Also, BHP benefitted from a one-time $10 billion increase in profits in 2022, which amplified its increase in profits.
Looking at profit after taxation from continuing operations, as this gives a more accurate depiction of the underlying business, the after tax profits to revenue percentages were 22%, 24% and 34% for 2020, 2021 and 2022 respectively. This means that BHP exceeded Apple’s fat margins during the last few years, and underlines that mining can also potentially also be a high margin business. Dividing BHP’s market cap of $159 billion by 2022 net income of $22.4 billion gives a P/E ratio of around 7, which is substantially lower than Apple’s P/E ratio. Part of this discount is likely due to the more cyclical nature of BHP’s business, but the discount is so significant, that BHP is likely much more undervalued than Apple.
Company Valuations
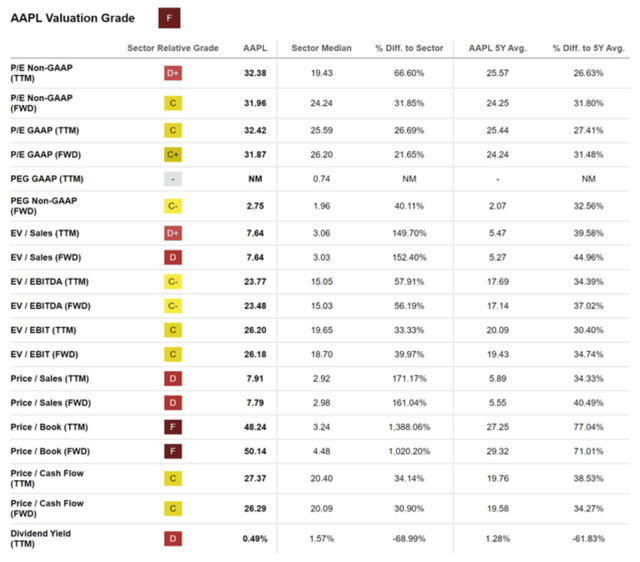
Not only is Apple an expensive stock in general, it is also expensive compared to the median IT stock. All of the valuation ratios for Apple in the table below point to it being overvalued compared to the median IT sector stock. Notably, the most recent P/E ratio for Apple is 32 compared to a P/E ratio of 26 for the median IT stock. More generally, Apple’s P/E ratio is around twice as high as that of a weighted portfolio of all global stocks, with the Vanguard Total World Stock Index Fund ETF (VT) having a P/E ratio of 17. Excluding all U.S. stocks, and thereby all the expensive U.S. tech stocks, gives an even lower P/E ratio of 13 for the Vanguard Total International Stock Index Fund ETF (VXUS).
In addition, Apple’s iPhone sales have hardly grown since 2015, making it unlikely the Apple’s sales growth will exceed the sales growth of the overall stock market. Stock market revenue growth is determined by GDP growth, and long run global real GDP growth is expected to be around 3% annually. Tacking on an inflation rate of around 3%, gives an revenue growth estimate for Apple of around 6%. Looking at historical data for Apple on Seeking Alpha, its net income as percent of revenues was 23% in 2015, which means that growth in earnings has closely tracked growth in revenues. Given its high current valuation, it would take a while for a 6% earnings growth to get Apple to a more reasonable valuation. If Apple is to reach a P/E ratio of 17, which is in line with the rest of the market, Apple’s stock price would need to stagnate over the next decade. This means that an investor in Apple would not see any return on investment with the exception of a meager dividend for at least 10 years, making it a potential poor investment moving forward.
The 263 holdings for PICK have a weighted P/E ratio of around 7 and a price to book ratio of around 1.5, which is substantially lower than similar values for Apple (see table below). Reasons cited for this low valuation include a global recession, and the commodity overinvestment that typically accompanies a commodity bull market. However, a global recession would impact all stocks including Apple and prices for commodities are still historically depressed (see figure below). Interestingly, the last time commodity prices were this low compared to the S&P 500, was during the tech bubble in the early 2000s. The following decade saw IT stocks underperform and commodity stocks overperform.
iShares Elements by Visual Capitalist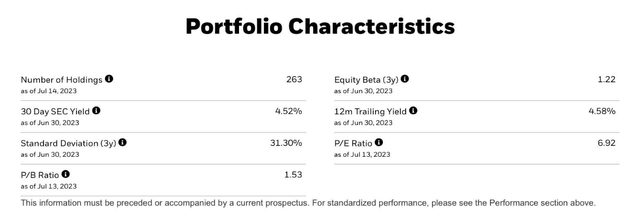
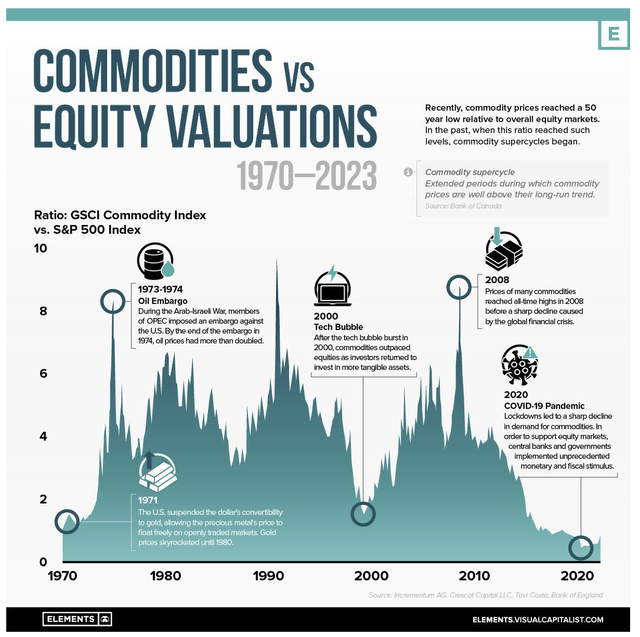
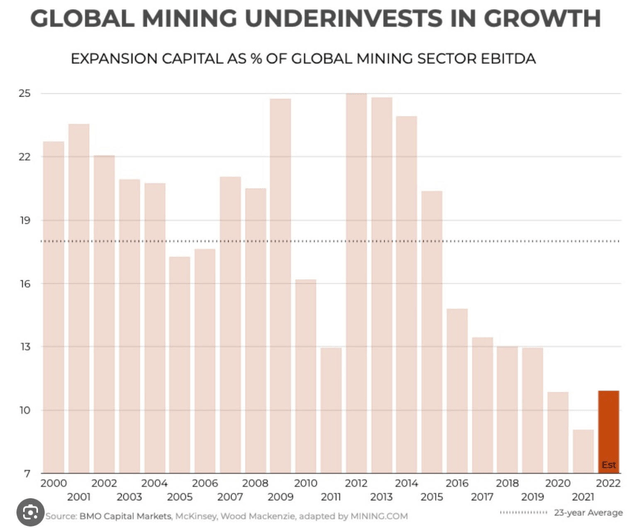
Also, unlike during the last commodity bull market, which ended a decade ago, mining companies are not investing many resources into increasing commodity production (see figure below). This means that PICK will likely do well over the next decade, as its price could double, and still be undervalued at a P/E ratio of around 14. Therefore, my main answer to why Apple currently trades at a premium to mining stocks, is that Apple is at the peak of its cycle, while mining stocks are close to the trough in their cycle. I think that this will eventually reverse, resulting in PICK outperforming Apple moving forward.
Investment Risks
The are a number of factors that could counteract the thesis of mining stocks outperforming Apple over the next decade. These factors can be grouped into two categories: (1) Apple exceeding expectations and (2) mining stocks falling further behind.
The revenues for Apple could grow faster than outlined in this article and this is what analysts of Apple forecast, with expected revenue increases of around 9% annually. However, this would still not justify Apple’s current high valuation. Analyst earnings estimates, while being slightly higher at 10% would also not justify this valuation. It is possible that Apple could release a highly successful new product, but given Apple’s high market capitalization, the revenues from this new product would have to be massive in order to move the needle.
Mining companies could underperform due to falling commodity prices, although this fall would likely be temporary, as very little investment has been made into increasing production. Mining companies could also suffer from cost increases exceeding the price increases of the commodities they sell, although this would also not be sustainable in the long run, as it would lead to further underinvestment in new production, which would eventually lead to higher commodity prices. Mining companies are also highly sensitive to political risk, as mines can’t be moved, incentivizing governments to increase their take of profits over time. However, these risks are typically company specific and should be ameliorated by investing in all mining companies through an ETF such as PICK. There are likely also companies that are less exposed to these risks, so the investor could also invest in a basket of these companies instead of buying an ETF covering the whole sector.
Final Thoughts
Apple and other mega cap tech stocks are priced to perfection, and therefore I think will they will likely underperform moving forward. Mining stocks are not priced for perfection, but are still exposed to many risks. This means I am very selective about the mining companies I invest in, and mainly hold royalty stocks, as royalty stocks benefit from commodity price upside, while being exposed to fewer downside risks. Royalty companies are also ideal inflation plays, as they receive a certain percentage of their revenue from a mine without bearing any of the costs. In addition, they benefit from volatility in commodity prices, as they can time their new royalty purchases to time periods where commodity prices are low. Sometimes, they can even benefit from governments increasing their take of mining companies profits, as Ecora Resources (OTCQX:ECRAF) benefitted from the Queensland, Australia government increasing their coal royalties last year. Two mining royalty companies I particularly like are base metals focused royalty company Ecora Resources (covered here) and high grade iron ore royalty company Labrador Iron Ore (OTCPK:LIFZF) (covered here).


