

ozgurdonmaz
In our previous analysis of Apple Inc. (NASDAQ:AAPL), we revised our revenue projections for the company with a full-year revenue growth forecast of 8.2% in 2024, which represents a recovery compared to its previous year’s revenue growth of -2.8%. We believed the company’s growth is poised to benefit from positive drivers this year with the company’s stable positioning in the premium smartphone market, anticipated recovery in the PC market as well as decent Services revenue growth leveraging its massive installed base. Moreover, in terms of profitability, we expected the company’s net margins to remain stable going forward with rising gross margins driven by its higher-margin Services segment growth but offset but higher R&D spending for its AI-related product developments.
In this analysis, we delved into the potential for Apple to harness the power of AI, particularly in light of its recent earnings briefing that emphasized the advancements in its Vision Pro and generative AI products. Firstly, we examined Apple’s commitment to AI developments and evaluated each of them, determining whether it has actual innovative new AI products or just enhancements to its product features. Moreover, we then examined whether Apple could leverage its strengths to execute on its AI developments. Finally, we estimate its revenue opportunities for its actual innovative AI developments including Vision Pro.
Apple’s AI Developments
Unlike Microsoft (MSFT) which we view as a leader in AI for Software & Services with an exclusive partnership with OpenAI benefitting it with GPT-4 LLM integration opportunities and widespread infusion of its AI capabilities across its entire product stack, especially productivity software and cloud, we see Apple being relatively late in AI developments and appears to be trying to catch up with competitors. For example, OpenAI has been developing its GPT LLM since 2019. Microsoft developed Copilot in 2022 in GitHub and released more Copilots for other products throughout 2023.
Furthermore, Apple has not provided significant details about its AI developments in the past. However, in its latest earnings briefing, CEO Tim Cook stated that he believed there is a “huge opportunity for Apple with GenAI and AI”. Additionally, management highlighted that it is focusing on internal product development on generative AI and expects to have more announcements later this year following its Apple Vision Pro Launch.
General AI Product Developments
We explained some of the features of AI that Apple has launched and are in development below.
- Apple Music: The company introduced Apple Discovery Station which leverages machine learning algorithms to identify the listening patterns of the user and generate a compiled personalized music playlist recommendation for the user.
- Deep Fusion: Apple’s latest iPhone models include features such as its Deep Fusion which is a tool that leverages machine learning for pixel processing and texture optimization to enhance photo quality. This works by taking 9 multiple shots when the user takes a picture and Apple’s neural engine analyzes each shot and selects each pixel individually that is optimized for higher detail and low noise, creating a higher quality image.
- Visual Lookup: Additionally, Apple also has the Visual Lookup feature which detects objects using iPhone cameras by leveraging object recognition technologies that collect an object’s features which are extracted and retrieveing information from a database of similar features to identify the object and provide insights about it.
- Apple Watch: Apple’s smartwatch functionalities include Fall Detection and Crash Detection which uses a range of sensors, microphone and GPS installed in the device to infer the wearer’s speed and positioning based on trained data collected from tests conducted by Apple.
- Siri: Apple’s well-known Siri voice assistant which has voice recognition technologies that use deep neural networks to convert speech patterns of the user’s voice and compares it with its database of speech sounds to detect the user’s speech.
- Autocorrect: Apple has introduced upgrades to its Autocorrect feature that is more personalized as it is powered by a Transformer AI model that learns the user’s text patterns and predicts the next words or phrases each user might use.
Overall, Apple has introduced and is reportedly developing a range of features using AI. However, based on our compilation of these features, we find that a lot of Apple’s AI developments have been basic AI integration in their products such as features recommending music recommendations, photo quality enhancement, voice assistants, autocorrect, crash detection and fall detection. All of these features are part of Apple’s underlying products such as its iPhones, Mac and Apple Watch. For example, Apple’s Deep Fusion and Visual Lookup features in the iPhone’s camera, Crash and Fall Detection features of the Apple Watch, Apple Discovery Station feature for Apple Music and Autocorrect and Siri across iPhone, Mac and iPad. Moreso, Apple’s management also highlighted that the company views these AI features as “integral to virtually every product”. Therefore, we believe this highlights that Apple’s developments have been to incrementally improve its product offerings rather than to create new innovative breakthrough products. For example, Apple’s Deep Fusion and Visual Lookup enhance the iPhone’s camera capabilities, Crash and Fall Detection as features of the Apple Watch provide value to users for enhanced safety and health monitoring, and Apple Discovery Station improves user experience in Apple Music.
We believe that all of these Apple innovations are general and imitable by competitors. For example, Spotify already has a similar feature called Spotify (SPOT) AI DJ for personalized music recommendations for each user. Smartphone competitors such as Samsung (OTCPK:SSNLF) also have AI features for photos including deep learning technologies for multi-frame processing to enhance image quality and Scene Optimizer which has the capabilities of object detection. Other smartwatches from Garmin (GRMN) and Samsung also have similar crash and fall detection functionalities. Thus, we believe this further supports our belief that these features are to improve its current product offerings rather than actual innovations.
Innovative AI Product Developments
We examined some of the unique AI innovations that the company has launched and is claimed to have in development such as Vision Pro and Xcode AI.
In Jan 2024, Apple launched its Vision Pro virtual reality headsets in the US and plans for an international launch this year. Based on the company’s earnings briefing, management highlighted two components of Vision Pro that are driven by AI which are the mapping and hand-tracking aspects of the device. In terms of mapping, Apple touts the Vision Pro as a “spatial computer” and introduced spatial computing, which enables devices to learn and interact with physical surroundings. A key concept of this is spatial mapping, a process of a 3D reconstruction of a map of the physical environment. This process involves collecting data from the physical environment by projecting dots onto objects using sophisticated depth-sensing technology including sensors, cameras and LiDAR that the Vision Pro is equipped with. The data and images are processed with computer vision algorithms in dedicated neural engines in its M2 chip with neural network computation acceleration capabilities enabling faster processing for real-time object and image detection to create a representation of the physical environment as well as facial analysis of the user. Furthermore, Apple’s Vision Pro also enables hand and eye tracking capabilities that work by collecting input data (hand gestures of the user) from the side, front and bottom-mounted cameras in the devices which capture the user’s hand gestures and infrared sensors that project light patterns onto the eyes and uses machine learning algorithms to process the data in the R1 chip, enabling the manipulation and interaction with the virtual environment by the user. Both spatial mapping and hand and eye tracking technologies enable Vison Pro to render the physical environment and further enable features such as passthrough mode which overlays virtual reality with the physical world, allowing the user to interact with both seamlessly.
According to Bloomberg, Apple is reportedly developing AI tools in its programming software, Xcode, which is Apple’s official software development tool used “to create apps (design, develop, and publish) for all Apple’s platforms: iOS, iPadOS, tvOS, watchOS, and macOS”. The claimed AI developments in Xcode could help software developers in coding by predicting and suggesting lines of code as well as converting code from different programming languages, which may allow third-party developers to save time. The tool is reported to share similarities in functionalities of Microsoft GitHub Copilot, which we previously covered in our Microsoft analysis as an AI assistant which helps programmers save time and increase productivity, thus we believe Apple is trying to do something similar to Microsoft’s Copilot which had been launched in 2022 with over 1 bln paid users as of 2023 and we estimated it to generate a revenue opportunity of $6.6 bln by 2028. However, Xcode’s revenue model is different as it is a free open-source platform for software developers and does not generate revenue for Apple directly. Though, developers may join the Apple Developer Program which provides additional tools and resources to build apps in the Apple ecosystem and which has an annual fee of $99 per year. Thus, we believe the AI developments would not generate revenue directly for Apple but may increase the competitiveness of the Apple Developer Program. We believe it could also help developers cut time to develop Apps on the Apple ecosystem, benefiting Apple with increased breadth on the AppStore, thereby increasing App Store purchases to generate higher commission revenue for Apple.
Summary
Overall, we believe Apple is capitalizing on AI mostly to improve the general capabilities of its existing products and services. We highlighted its AI developments which we believe are only general AI developments to improve the company’s current product offerings to an extent that may keep the company on with competitors such as AI features in its iPhone camera, music playlist recommendations, crash and fall safety detection features, enhanced autocorrect and voice assistants. Notwithstanding, we also identified several key AI innovations namely its recently launched Vision Pro headset and Xcode AI features reportedly in development. Furthermore, Apple has also been reportedly developing other generative AI tools such as “Apple GPT”, an AI chatbot that could be similar to that of Microsoft Copilot (Bing Chat) and Google Gemini. However, Apple has not yet announced further details regarding this product development and has only held an AI summit in February 2023 briefing employees of its LLM in development. Moreover, Apple was believed to be developing a self-driving car since 2014 but has reportedly been canceled according to Bloomberg, thus further supporting our view that Apple’s AI developments are more centered around enhancing its current product offerings rather than new innovative products.
Factors That Could Support Apple’s Success in AI
In this point, we examine whether Apple could be able to leverage its strengths in its innovative AI developments by examining factors such as its AI model developments, installed base & ecosystem, customer loyalty, pricing power and Apple Silicon.
LLM Development
|
LLM |
Company |
Number of Parameters (‘bln’) |
|
GPT-4 |
OpenAI |
~1,800 bln |
|
Switch |
Google (GOOG) |
1,600 bln |
|
Megatron-Tuning |
NVIDIA (NVDA) |
530 bln |
|
PaLM2 |
|
340 bln |
|
ERNIE 3.0 TITAN |
Baidu (BIDU) |
260 bln |
|
Ajax |
Apple |
~200 bln |
Source: Research Reports, Khaveen Investments
According to The Information, Apple is developing its own LLM trained with 200 bln parameters. In comparison, we previously highlighted that OpenAI’s GPT3.5 models have 175 bln parameters. However, OpenAI’s newer GPT-4 model surpasses this with over a trillion parameters and has the highest MMLU benchmark score. Additionally, Google’s Switch and PaLM2 LLMs are also larger at 1.6 tln and 340 bln parameters respectively. Also, NVIDIA and Baidu also have LLMs with larger parameters of 340 mln and 260 mln. Therefore, Apple’s reported 200 bln parameters pale in comparison with competitors which could indicate a disadvantage, though Apple has yet to make an official announcement. That said, Apple’s LLM developments coincide with the reported generative AI developments of Apple. For example, Apple is reportedly developing improvements in features for Spotlight in iOS, a built-in search tool that allows users to navigate different apps and locate documents as well as perform online searches, with integration with LLM to generate more complex and personalized search results. Apple is also reportedly planning to improve Siri by integrating it with an LLM. Additionally, Apple could be developing generative AI tools in Keynote such as AI-generated images and presentation slides. Besides that, Apple has also released various other AI models such as MLX which allows developers to train AI models using Apple Silicon chips as well as its MGIE text-to-image AI model.
Overall, we believe Apple’s LLM development could be disadvantaged compared to competitors based on the reported parameters of its model as it is lower than 5 other LLMs. This is due to the higher computational power of its competitors’ LLM based on the number of parameters which we explained previously refers to the values learnt by the AI model during training and requires higher computational resources for larger LLMs. Moreover, we highlighted the increasing computational power requirement trend over the past 2 decades as LLMs become larger. We believe the largest LLM, GPT-4, provides opportunities for Microsoft to leverage it by integrating with its product and service stack and increasing its competitiveness. Furthermore, OpenAI is already developing its next GPT-5 model while Google has recently released its new Gemini models.
Installed Base and Apple Ecosystem
In our previous analysis, we highlighted that Apple has a massive total installed base of 2 bln in 2023 which allows the company to leverage on for its Services business. Additionally, Apple has an active iPhone user base of 1.46 bln. We believe AI products such as the Vision Pro could allow the company to leverage its massive installed base. One of the aspects of this is due to the Apple Ecosystem. Apple’s products all share a similar operating system produced by the company, allowing the integration and connectivity between different Apple products such as its smartphones, tablets, PCs, wireless earphones and smartwatches. Apple Vision Pro can be linked to the user’s iPhone and connected to Mac. Apple Vision Pro also allows users to access many Apple apps “including Books, Camera, Contacts, FaceTime, Mail, Maps, Messages, Music, Notes, Photos, Safari”.
Customer Loyalty
Additionally, we also previously highlighted Apple’s branding advantage as the top brand among smartphone competitors. Apple Vision Pro was reported to have preorders of 200,000 units despite its premium pricing. We also highlight the strong customer satisfaction across Apple’s products including iPhone 15 (99% customer satisfaction), Mac (97% customer satisfaction), iPad (98% customer satisfaction), Apple Watch (96% customer satisfaction) according to Apple based on 451 Research surveys. Previously, we also highlighted the strong customer loyalty seen by its stable sales performance despite the smartphone market contraction in 2022 and 2023.
Pricing Power
Apple’s Vision Pro has a retail price starting at around $3,500 which is 7x more expensive compared to market leader Meta’s Quest with over a 50% market share. Furthermore, based on our calculated average of the top VR headset companies (Meta, Sony, Pico and Microsoft) including Apple, we find Apple to be significantly more expensive (2.2x) than the average ($1,710). However, we believe its premium pricing should not be surprising as in our past analyses, we determined the premium pricing power of Apple with higher pricing than competitors across smartphones, PCs, wireless earphones and smartwatches.
Apple Silicon Chips
|
Comparison |
Vision Pro |
Meta Quest |
PlayStation VR (SONY) |
Pico (ByteDance) |
Microsoft HoloLens |
|
Chipset |
M2 and R1 |
Snapdragon® XR2 Gen 2 |
Custom MediaTek Soc |
Snapdragon XR2 Gen 2 |
Snapdragon 850 Compute Platform |
Source: Khaveen Investments
Based on the table above, we compared the chipsets used by the top XR headset companies. Apple is the only company that uses its own chipset (the M2 and R2) while Meta, Pico and Microsoft use Snapdragon chips by Qualcomm (QCOM) (XR2 and 850). Sony’s PS VR headset is the only one with a custom-made MediaTek chipset. We compared the chipset performance of the Snapdragon and M2 chips (excluding MediaTek due to it not being publicly disclosed as a custom chip) in the table below to determine which has an advantage.
|
Processor |
Apple M2 |
Qualcomm Snapdragon XR2 5G |
Qualcomm Snapdragon 850 |
|
Lithography |
5 nm FinFET N5P |
7 nm N7+ |
10 nm FinFET LPP |
|
Cores |
8 |
8 |
8 |
|
Threads |
8 |
8 |
8 |
|
Base Frequency |
2.42 GHz |
1.8 GHz |
1.8 GHz |
|
Turbo Frequency |
3.5 GHz |
2.84 GHz |
2.95 GHz |
|
Cache Memory |
20 MB |
4 MB |
1 MB |
|
Max Memory Capacity |
24 GB |
6 GB |
8 GB |
|
GPU Integrated Graphics |
Apple M2 GPU 10-Core |
Qualcomm Adreno 650 |
Qualcomm Adreno 630 |
|
GPU Clock |
587 MHz |
710 MHz |
|
|
GPU FP32 Floating Point |
1,398 MHz |
1,267 GFLOPS |
737 GFLOPS |
|
Geekbench Average Single-core |
3,578 GFLOPS |
1,128 |
1,365 |
|
Geekbench Average Multi-core |
4,223 |
2,776 |
4,371 |
Source: Gadget Versus, Khaveen Investments
Based on the table, Apple M2 stands out as the superior processor. It utilizes a cutting-edge 5 nm lithography. With an impressive 20 MB cache memory and a powerful 10-core GPU clocked at 1,398 MHz, the M2 surpasses both the Qualcomm Snapdragon XR2 5G and Snapdragon 850 in terms of graphics processing capabilities, boasting a remarkable 3,578 GFLOPS for GPU FP32 floating point operations. Additionally, the M2 exhibits exceptional Geekbench scores, dominating in both average single-core (4,223) and multi-core (18,170) performance.
Overall, Apple’s chip is more powerful compared to Qualcomm’s chips as Apple is leveraging its M2 chip which was designed and used primarily for its MacBook PCs while Qualcomm’s chips are designed specially for XR headset applications. This is as we explained in the point above the company highlighted Vision Pro as a “spatial computer” and uses its M2 chips to enable computer vision algorithm data processing for its 3D mapping technology. However, the drawback of using the more powerful chip is that it consumes more power and impacts the device’s battery life.
Conclusion
Overall, we believe that Apple could be successful in its AI developments due to its main strengths in terms of its massive Installed Base of 2 bln devices in 2023 and in particular in smartphones due to its massive smartphone installed base of over 1.4 bln. Furthermore, Apple Ecosystem has a large breadth of applications across multiple devices based on a similar operating system. Additionally, we believe the company’s customer loyalty across its products such as smartphones, PCs, tablets, wireless headphones and smartwatches, indicates its highly loyal customer base which could support the company’s product adoption of its new AI products. In addition, the company has strong pricing power as seen by its premium pricing in Vision Pro, which is unsurprising considering our past analyses of its premium pricing across its product range. Thus, we believe this highlights that consumers may be willing to pay more for Apple’s AI products which benefit the company with higher revenues from higher ASPs compared to competitors. Finally, we believe its chipset performance such as in Vision Pro highlights the company has stronger chip capabilities compared to competitors which it could leverage to increase its AI development and competitiveness against existing competitors. Additionally, we believe its development of its own LLM may support its AI development though may be disadvantaged against other leading LLMs due to the reported small size in comparison.
Vision Pro Revenue Opportunity
Finally, we examined the potential revenue opportunity for our identified Apple’s actual AI product innovations. However, since most of its products are still in development with no indication of further details (Apple GPT and Xcode AI), we examined the revenue opportunity for Vision Pro. Firstly, we examined the XR market and compared Vision Pro with its top competitors in terms of spec performance, pricing, branding, functionalities and enterprise presence.
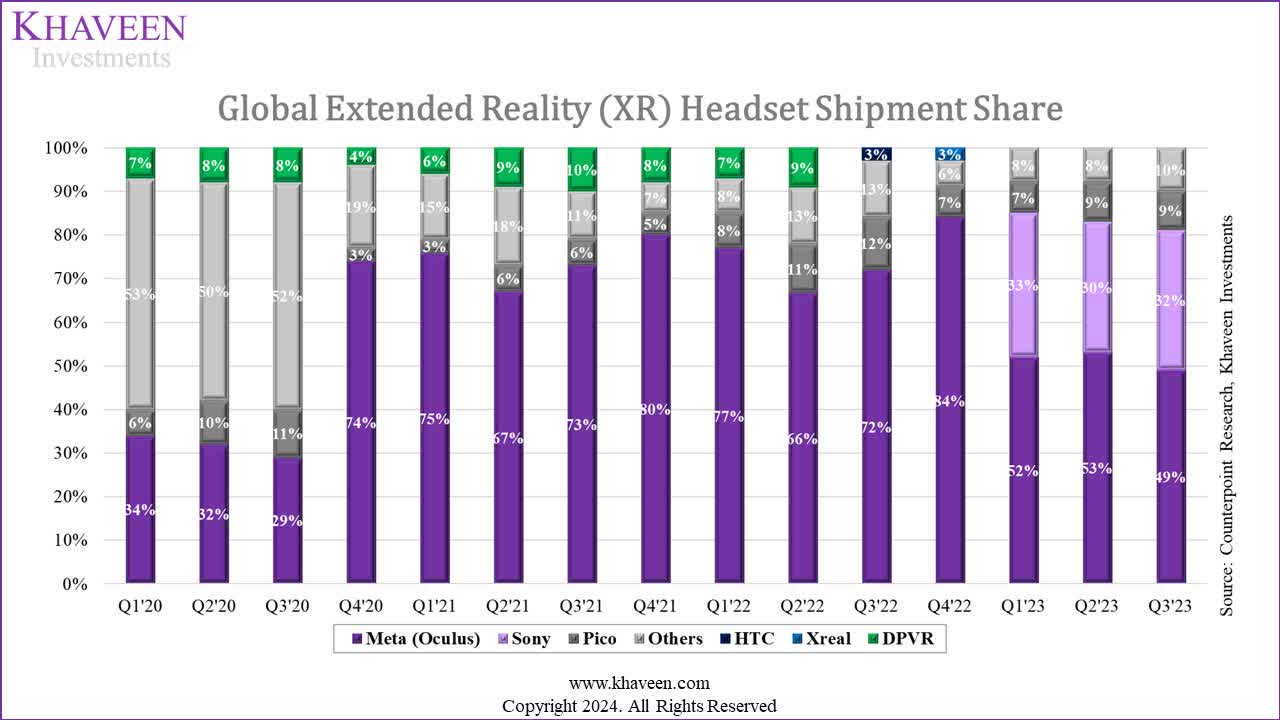
Counterpoint Research, Khaveen Investments
Based on the chart above, the XR market (including VR and AR) is currently led by Meta with the highest market share of 49% in Q3 2023 followed by Sony with the launch of its PlayStation VR2. Microsoft is included under Others.
|
XR Market Forecast by Source |
Forecast CAGR |
|
IDC |
37.20% |
|
Counterpoint Research |
65.1% |
|
Mordor Intelligence |
34.95% |
|
Frost & Sullivan |
40.90% |
|
Precedence Research |
33.09% |
|
Average |
42.24% |
Source: Khaveen Investments
We compiled the market forecast CAGR of the XR market above. The average forecast CAGR is 42.24% based on IDC, Counterpoint Research, Mordor Intelligence, Frost & Sullivan and Precedence Research. We segmented the growth drivers of the XR market for the consumer segment and enterprise segment previously in our previous Qualcomm analysis. For the consumer drivers, this includes entertainment such as (games, movies and TV shows), virtual shopping, virtual travel and virtual sports. For the enterprise segment, this includes military (enhanced combat field of view), manufacturing (industrial design and modeling & remote factory monitoring), healthcare (VR therapy, minimally intensive medical surgery), and retail (enhanced employee training). We believe Vision Pro could benefit from drivers such as entertainment as it features more than 250 Apple Arcade Games and has immersive video and 3D movie features. Moreover, Apple has signed long-term sports deals with MLS and MLB and allows users to watch sports using Vision Pro. Moreover, for the enterprise segment, one of the drivers we believe it could benefit from is employee training due to its simulation capabilities.
Features Comparison
|
Features Comparison |
Vision Pro |
Meta Quest |
Sony |
Pico |
Microsoft HoloLens |
|
Spatial Video (Video Recording) |
Yes |
Yes |
Yes |
Yes |
Yes |
|
Spatial Audio |
Yes |
Yes |
Yes |
Yes |
Yes |
|
Virtual Avatars |
Yes (Digital Persona) |
Yes (Meta Avatars) |
N/A |
N/A |
N/A |
|
Video Streaming/ Video Calling |
Yes |
Yes |
Yes |
Yes |
Yes |
|
Number of Apps |
1.5 mln compatible apps (1,000 apps designed for Vision Pro) |
1,000 |
252 |
400+ |
200+ |
|
Controllers |
Hand and eye tracking |
Touch Plus Controllers, Hand Tracking |
Controllers |
Controllers |
Controllers |
Source: Company Data, Khaveen Investments In a comparison of the headsets by functionalities, Vison Pro supports spatial video recording, spatial audio, virtual avatars (with Digital Persona) and video streaming or calling, as do most of the competitors. However, Vision Pro outshines them with an impressive 1.5 mln compatible apps, including 1,000 apps specifically designed for the device, highlighting Apple’s robust and diverse app ecosystem strength. Moreover, Vision Pro incorporates innovative hand and eye-tracking controllers, providing a more intuitive and immersive user experience compared to the controllers used by its counterparts. Overall, we believe Apple stands out in terms of features mainly due to its strength of the number of apps supported with far more apps compared to competitors and a more intuitive control system based on its hand and eye tracking technology.
Hardware Specs
|
Hardware Specs Comparison |
Vision Pro |
Meta Quest |
PlayStation VR (Sony) |
Pico (ByteDance) |
Microsoft HoloLens |
|
Display Quality Per Eye (mln pixels) |
23.0 |
4.6 |
4.1 |
4.0 |
1.3 |
|
Refresh Rate |
90Hz, 96Hz, 100Hz |
90Hz, 120Hz (experimental) |
90Hz, 120Hz |
90Hz |
120Hz |
|
Battery Life |
2 hours |
2 hours |
4 hours |
2 hours |
2-3 hours |
|
Field of View |
120° horizontal / 92° vertical |
110° horizontal / 96° vertical |
Approx. 110 degrees |
105 degrees vertical |
96.1 degrees |
|
Cameras |
12 cameras, 6 mics and 5 sensors |
2 RGB cameras with 18 PPD |
N/A |
16MP RGB camera |
8-MP RGB camera |
|
Weight |
600-650g |
515g |
560g |
295g |
566g |
Source: Company Data, Khaveen Investments
As seen above, one of the advantages of Apple’s Vision Pro is in Display Quality with 23 mln pixels, well ahead of its competitors as Apple’s Vision Pro features Micro-OLED screens which “provide much higher resolution and sharper contrast than the liquid crystal displays found in most VR headsets”. However, the Vision Pro falls short in terms of refresh rate with a max of 100Hz in comparison with 120Hz support by most competitors except Pico. Additionally, Vision’s Pro battery life is tied with Meta and Pico but behind Sony and Microsoft. However, Vision Pro is equipped with more cameras and sensors including 12 cameras, 6 mics, and 5 sensors for advanced tracking and interaction as well as a wider field of view. Though, Vision Pro is slightly heavier than its competitors.
Branding
|
Comparison |
Vision Pro |
Meta Quest |
PlayStation VR (Sony) |
Pico (ByteDance) |
Microsoft HoloLens |
|
Company Branding (Interbrand) |
1 |
21 |
36 |
NA |
2 |
|
Google Trends |
28 |
8 |
<1 |
<1 |
<1 |
Source: Interbrand, Google Trends, Khaveen Investments
In terms of brand recognition, Vision Pro holds the top position (1) according to Interbrand, followed by Microsoft HoloLens (2), Meta Quest (21), PlayStation VR (36), and Pico. Google Trends indicates Vision Pro with the highest popularity (28), followed by Meta Quest (8), while PlayStation VR, Pico, and Microsoft HoloLens have minimal search interest.
Pricing Comparison
|
Comparison |
Vision Pro |
Meta Quest |
PlayStation VR (Sony) |
Pico (ByteDance) |
Microsoft HoloLens |
|
Average Price ($) |
3,699 |
540 |
548.6 |
514.2 |
3,250 |
Source: Company Data, Khaveen Investments
In terms of pricing, Vision Pro and Microsoft HoloLens are significantly more expensive at an average of $3,699 and $3,250, respectively, while Meta Quest is the most affordable at $540. Based on its earnings briefing, Apple highlighted that enterprises such as “Walmart, Nike, Vanguard, Stryker, Bloomberg, and SAP” are purchasing its Vision Pro. However, we believe Microsoft has an advantage in the enterprise market with over 18 mln business customers on Microsoft 365 and 8.1 mln active Azure users. Additionally, we see Sony’s leadership in the gaming market supporting its VR headset for the consumer segment.
Factor Competitive Score
|
Factor Score |
Vision Pro |
Meta Quest |
Sony |
Pico |
Microsoft HoloLens |
|
Features |
1 |
2 |
4 |
3 |
5 |
|
Hardware Specs |
2 |
1 |
2 |
4 |
5 |
|
Branding |
1 |
3 |
4 |
5 |
2 |
|
Pricing |
5 |
2 |
3 |
1 |
4 |
|
Average |
2.25 |
2 |
3.25 |
3.25 |
4 |
|
Factor Score |
1.19 |
1.25 |
0.94 |
0.94 |
0.75 |
Source: Khaveen Investments
Overall, based on our comparison, we ranked the companies in terms of features, hardware specs, branding and pricing. We ranked Apple at the top for features and branding and second in terms of hardware specs only behind Meta. However, for pricing, we ranked it as the lowest due to its premium pricing. Overall, we derived an average ranking of 2.23 for Apple and derived a factor score of 1.19x based on an equal weightage for each factor.
Revenue Projection
Overall, we believe that Apple is poised to capitalize on the XR market growth of an average of 42.24% due to the strengths that we identified in terms of its features and branding. We projected the revenue of Vision Pro in this section. Firstly, we estimate the sales for Vision Pro in its first year of launch based on average estimates by analysts and research firms with the average price of Vision Pro ($3,699). Moreover, we then projected the growth of Vision Pro revenues based on our calculated average market forecast CAGR and accounted for Apple’s advantage with a factor score of 1.13x.
|
Apple Vision Pro Sales Forecast |
Units |
|
IDC |
200,000 |
|
Technopedia |
350,000 |
|
TF Securities |
500,000 |
|
Statista |
350,000 |
|
CCS Insights |
500,000 |
|
UBS |
400,000 |
|
Wedbush |
600,000 |
|
Average |
414,286 |
Source: IDC, Technopedia, TF Securities, Statista, UBS, Wedbush, Khaveen Investments
Based on our compiled estimates of Vision Pro sales from various sources, we derived an average of 414,286 units in 2024 which we used for our unit sales assumption in 2024.
|
Wearables, Home, and Accessories Segment Revenue Estimates ($ mln) |
2021E |
2022E |
2023E |
2024F |
2025F |
2026F |
2027F |
|
Apple Watch |
15,053 |
17,600 |
17,255 |
18,504 |
19,845 |
21,282 |
22,823 |
|
Growth % |
16.92% |
-1.96% |
7.24% |
7.24% |
7.24% |
7.24% |
|
|
AirPods |
19,687 |
18,992 |
17,238 |
19,306 |
21,623 |
24,217 |
27,122 |
|
Growth % |
-3.53% |
-9.24% |
12.00% |
12.00% |
12.00% |
12.00% |
|
|
HomePod |
3,104 |
2,853 |
3,341 |
3,912 |
4,463 |
4,959 |
5,360 |
|
Growth % |
-8.11% |
17.10% |
17.10% |
14.10% |
11.10% |
8.10% |
|
|
Vision Pro |
1,532 |
2,301 |
3,455 |
5,188 |
|||
|
Growth % |
50.2% |
50.2% |
50.2% |
||||
|
Others |
530 |
1,785 |
2,012 |
2,305 |
2,573 |
2,794 |
2,951 |
|
Growth % |
236.5% |
12.7% |
14.6% |
11.6% |
8.6% |
5.6% |
|
|
Total |
38,375 |
41,230 |
39,845 |
45,560 |
50,804 |
56,707 |
63,445 |
|
Growth % |
7.4% |
-3.4% |
14.3% |
11.5% |
11.6% |
11.9% |
Source: Company Data Khaveen Investments
Overall, based on our forecasts, we derived an estimated revenue opportunity of $1.5 bln for Vision Pro for the company in 2024 with a growth forecast of 50.2% based on the average XR market growth accounted for our factor score for Apple of 1.19x, reaching $5.2 bln by 2027, which is 8% of its segment revenue but only 0.4% of the total company revenue.
Risk: Competition in AI Developments
While we highlighted several strengths of Apple which we believe could allow it to capitalize on its AI opportunities, we believe the company faces competitive risk from the rapid pace of innovation in AI from larger competitors such as Microsoft leveraging its OpenAI partnership with the most advanced LLM integrated across its products and services creating monetization opportunities such as with Copilot as well as Google’s introduction of AI features across its productivity and search products. As highlighted, we believe Apple appears to be playing catch up with competitors in AI such as with Apple GPT and Xcode which are still in the development stage, and we will wait for further announcements by Apple in AI as management had promised this year, to assess Apple’s future innovative AI opportunities besides Vision Pro which is only a minor contributor to its revenues (0.4% of total).
Valuation
|
Apple Revenue Projections ($ bln) |
2023 |
2024F |
2025F |
2026F |
|
iPhone |
200.6 |
213.38 |
227.00 |
241.48 |
|
Growth % |
-2.4% |
6.4% |
6.4% |
6.4% |
|
Mac |
29.4 |
34.50 |
36.69 |
37.06 |
|
Growth % |
-26.9% |
17.5% |
6.3% |
1.0% |
|
iPad |
28.3 |
27.20 |
26.14 |
25.13 |
|
Growth % |
-3.4% |
-3.9% |
-3.9% |
-3.9% |
|
Wearables, Home and Accessories |
39.8 |
45.56 |
50.80 |
56.71 |
|
Growth % |
-3.4% |
14.3% |
11.5% |
11.6% |
|
Services |
85.2 |
95.57 |
107.07 |
119.85 |
|
Growth % |
9.0% |
12.2% |
12.0% |
11.9% |
|
Total |
383.3 |
416.2 |
447.7 |
480.2 |
|
Total Growth % |
-2.8% |
8.6% |
7.6% |
7.3% |
Source: Company Data, Khaveen Investments
We updated our revenue projections for Apple from our previous analysis with an update to the Wearables, Home and Accessories segment to include Vision Pro revenue. However, we see Vision Pro’s revenue growth contribution to the segment as minor in 2024 at only $1.5 bln but rising to $5.2 bln by 2027.
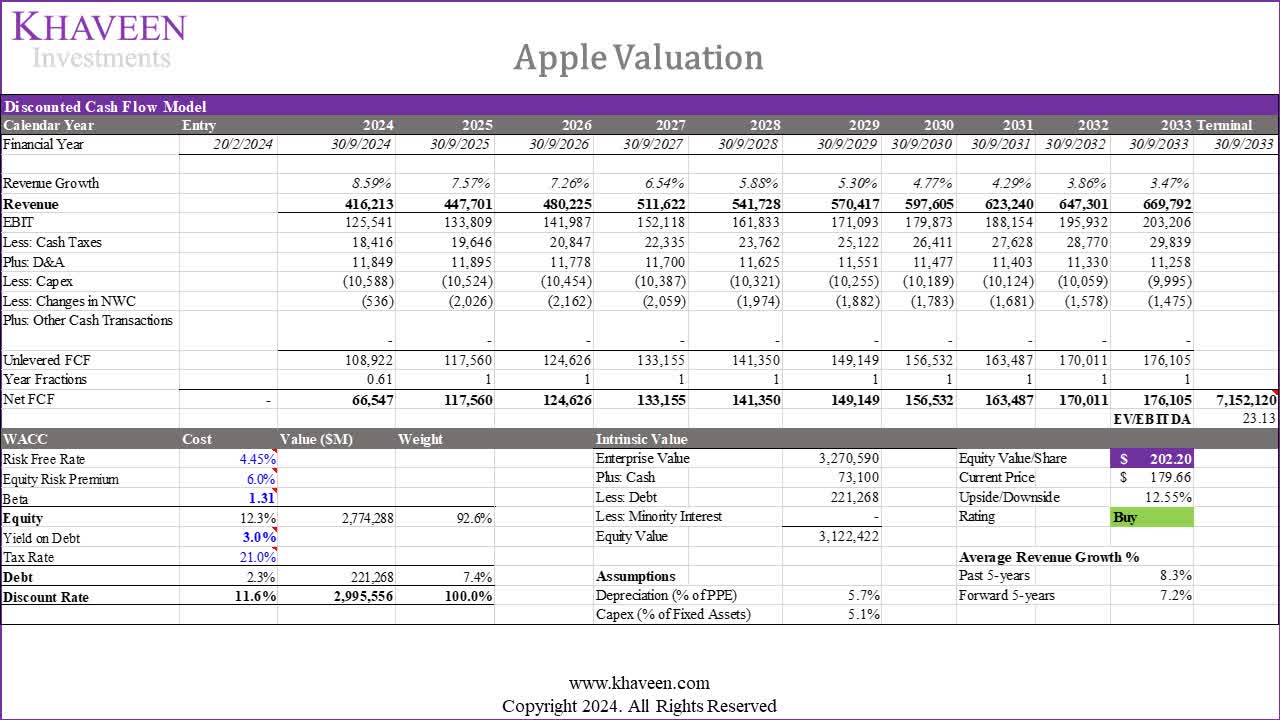
Khaveen Investments
Based on a discount rate of 11.6%, our DCF valuation model shows an upside of 11.6% based on a weighted average EV/EBITDA of 23.13x.
|
DCF Valuation Upside |
12.55% |
|
Stock Buyback Adjustment |
4.3% |
|
Total Upside |
16.86% |
|
Price Target |
$209.95 |
|
Current Price |
$179.66 |
Source: Khaveen Investments
Furthermore, we accounted for the company’s large stock buybacks by adding its 10-year average stock buyback % of the market cap of 4.3% from our previous analysis with our revised DCF model upside to derive a total upside of 16.86%.
Verdict
All in all, we believe Apple strategically utilizes AI to enhance existing products and services, focusing on features within its products like iPhone camera capabilities, music recommendations, and safety detection. Despite these general AI features, we highlighted potentially exciting innovative AI developments such as Vision Pro which has recently launched in 2024 as well as future developments such as Xcode AI features and Apple GPT. We believe Apple could leverage several strengths to be successful in its innovative AI product development by leveraging its massive 2 bln device installed base, a robust and unique ecosystem and loyal customer base across various devices. Additionally, the company’s strengths are reflected by its pricing power as well as chipset capabilities which it utilizes across products including Vision Pro. We anticipate Apple to capitalize on the projected 42.24% average XR market growth. Our revenue projections for Vision Pro, factoring in sales estimates, calculated market forecast CAGR, and Apple’s advantage, indicate a $1.5 bln revenue opportunity in 2024, with a strong forecasted average 50.2% growth to $5.2 bln by 2027. Based on our updated valuation, we upgrade Apple to a Buy with a higher price target of $209.95, due to higher revenue growth from Vision Pro, at a 5-year forward average of (7.2% vs 6.9% previously)