Wirestock
Countless digital ink has been spilled over the last few weeks about the state of Apple (NASDAQ:AAPL), the company’s new iPhone line, and how the valuation looks in today’s market.
However, comparatively little has been said about a massive technical shift that just took place over the last few weeks – a move that amounts to one of the biggest technical rejections the stock has seen in years.
Today, we’ll break down the recent price action, explain what it means, and map out where the stock might be headed next.
Sound good?
Let’s dive in.
Support & Resistance
Before talking about the recent move or its significance, it’s important to discuss what ‘Support’ and ‘Resistance’ are.
In classical technical analysis, a support is a level in a stock where demand consistently exceeds supply. In other words, a support is a level where price typically bounces.
Conversely, ‘Resistance’ is a spot where supply typically outstrips demand – and price usually reverses lower.
These are important psychological levels, and when they don’t hold up, it can lead to a strong trend in one direction or the other, as longs and shorts unwind their losing positions and trend followers enter the market.
This is why all-time highs tend to cluster; as a new high is made, more and more highs follow as one side of the market overtakes the other. Then a trading instrument gains momentum, which attracts more and more CTA-style capital, and the trend becomes self-sustaining.
As these ideas have become more well understood, technicians have begun to get more and more specific about the levels at which they trade, and what ‘counts’ and what ‘doesn’t’ when it comes to a true breakout vs. a rejection.
And, recently, what we’ve seen in Apple has been a solid rejection. Let’s take a look more closely at what we’re talking about.
Rejection
A common way to determine important support and resistance levels is to use former swing high and swing low points. This is a good way of helping determine whether or not a market is trading within a range or trending strongly.
Let’s look at a few examples from AAPL’s past.
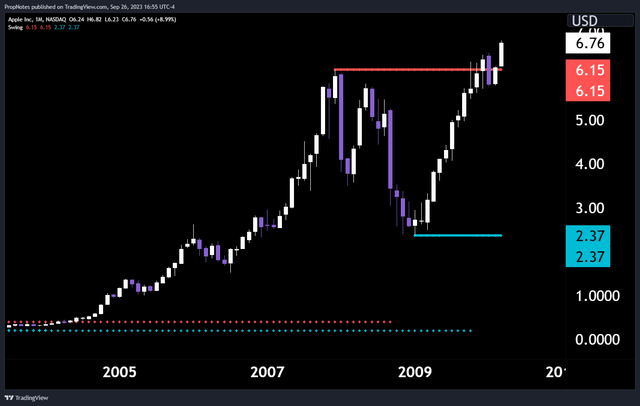
In this example from 2009, we can see AAPL trading between $2.37 and $6.15:
Then, the stock breaks out above $6.15 and stays there, eventually going on to run to ~$21.50, where it made a new swing high:
Over time, the stock then made a number of new swing highs and swing lows, breaking out cleanly above swing highs each time, and each time gaining a significant amount of ground:
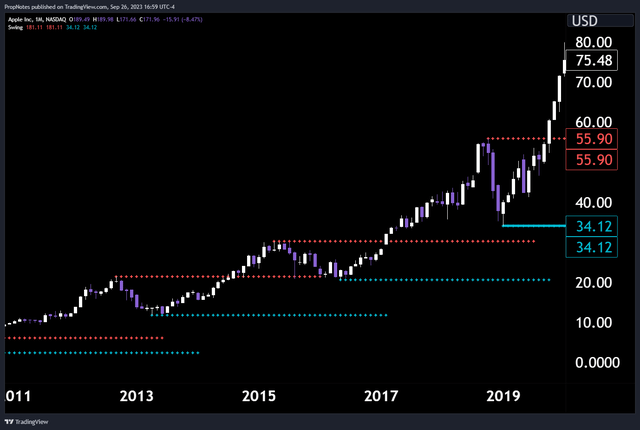
Then, coming into the present day, we can see that the stock broke out from a high near $56, trading all the way up to $181.11:
Remember: the last swing low that AAPL saw on this monthly chart is still down at $34.12.
However, something interesting happened in this most recent breakout.
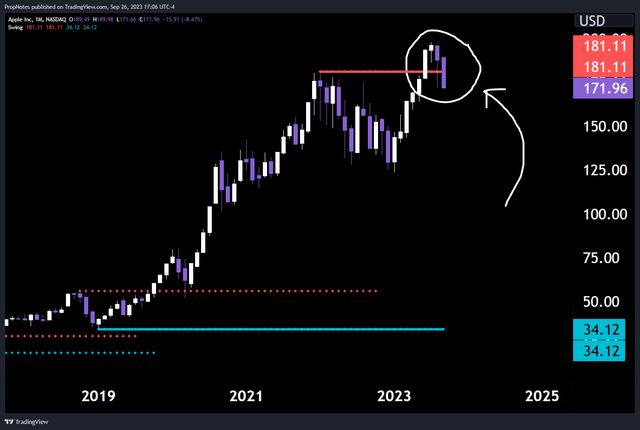
Instead of continuing up to higher highs, the stock failed hard:
After consistently breaking out cleanly, or breaking out, retesting the key level, and then continuing higher, AAPL stock has firmly broken out, failed, and remained within the previous range, between $181 and $34. Normally, on a lower timeframe, this wouldn’t trigger any alarm bells, as smaller timeframes can be choppy.
However, on a higher timeframe like a monthly chart, this is a significant rejection that should be noticed.
The typical cascade of buyers into AAPL didn’t arrive, and long positions took their chance to profit.
If you zoom out and look at the company holistically, it makes sense.
Other Factors
When it comes to AAPL, it’s clear why the stock has outperformed for such a long time, and caught a bid every time it’s broken higher
The company has continued to increase revenue and free cash flow, all while reducing share count:
However, recently, there have been some issues. TTM revenue growth has slowed and even turned into a period of complete stagnation around 380 billion, and the same goes for TTM free cash flow which peaked more than 9 months ago.
Paradoxically, the stock is also trading at some of its highest valuations of the last decade, near 30x FCF and 7x revenue. These multiples have come off of highs slightly following some recent news around Chinese government iPhone bans, but they’re still elevated overall.
Thus, it may make sense why the stock hasn’t caught as much of a fresh bid as it usually does when it sees highs.
Growth has stagnated, the multiple is expensive, and the easy money has been made by trend followers up to this point where the stock looks much more fully valued.
But where do we go from here?
Price Target
In our view, the stock hasn’t made a new swing low before making this second swing high to break through and ultimately fail on.
It’s likely that in the coming weeks and months that the stock will try to find demand at a new level. The $125 level is a solid candidate for this target, as it’s where the stock bounced before in January of this year before joining the other AI names on a world-beating run.
That said, it’s unlikely that Apple bulls will let the stock get ‘this’ cheap, barring some disaster with the Vision Pro, or another important product (although there are signs of this happening with the recent iOS17 launch & overheating devices).
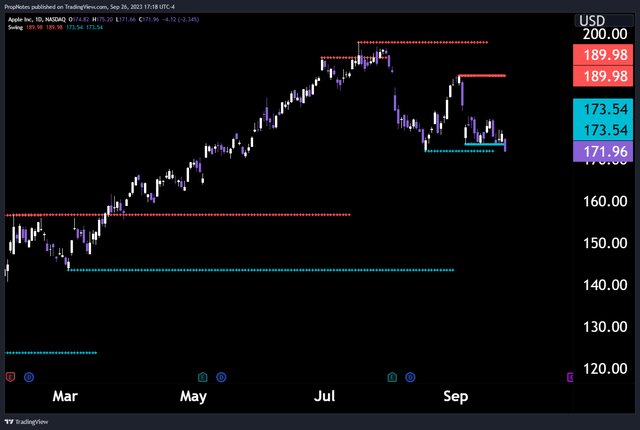
Most likely? The stock continues to chop around for a while until it builds strength again for a new run at highs. We’re looking towards the 143 level which may see a fresh bid come in as the stock continues to break down on smaller timeframes:
Summary
All in all, the recent technical shift in Apple is important to take note of given the significance of the run-up to this point, combined with the fact that new buyers just aren’t entering the stock in the same way they have in the past.
We don’t think shorting the stock is prudent, given the age-old saying “never short stock in a company with a good product”, but it may make sense to trim some AAPL off the table while the opportunity cost is high and the actual opportunity is low.
If you enjoyed this article, please share it with a friend who may appreciate it too!
Cheers~


