- The Fed’s Jackson Hole speech was largely uneventful last week
- Tech sector could face headwinds, and gold and silver could rally
- Meanwhile, the Chinese economy is starting to show signs of weakness
Last week, everyone had their eyes fixed on what Jerome Powell would say at the event. The big question was whether he’d once again try and sound cautiously hawkish.
Many interpreted his words that way, though the reality was a bit different. In truth, there wasn’t much to anticipate as toning down concerns about was seen as a risky move.
Sure, the speech was touted as a crucial event, and although it aimed to convey a forceful message, it didn’t actually bring any fresh insights.
In essence, the summary can be boiled down to one simple sentence:
“Our objective remains focused on achieving and maintaining a 2 percent inflation rate.”
This isn’t exactly revolutionary news, which is why the market’s response was somewhat subdued when compared to the buildup before the speech.
As of today, the for a rate hike in September stand at around 20%, with the likelihood of a November hike hovering at approximately 45%.
The Fed seems to have forgotten about 2020, a year when it caused higher inflation through helicopter money.
However, the focus has shifted, and now it’s aiming for lower inflation. It’s possible that both the Federal Reserve and other central banks might achieve their goal of promoting disinflation.
Tech Stocks Near Critical Resistance
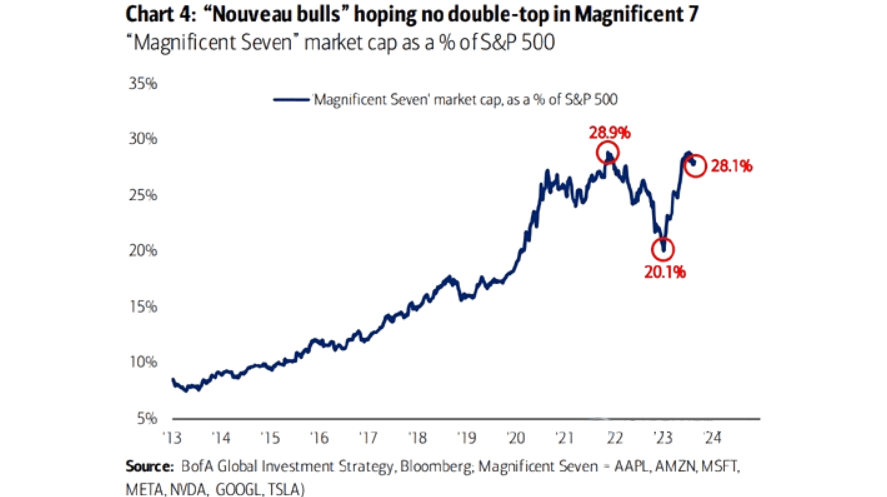
In 2022, tech stocks surged to a peak of 29% within the but then experienced a decline from late 2022 to early 2023.
Source: BofA Global Investment Strategy
However, they’ve recently staged a resurgence, reasserting their dominance in the index and accounting for approximately 28% of the total market capitalization.
Currently, the Technology sector (NYSE:) appears to be encountering a hurdle as it remains below the highs from the prior cycle.
Interestingly, a similar candlestick pattern that occurred in 2021, triggering a retracement of over 30%, has made a reappearance.

While this holds true, when we broaden our perspective and consider the potential for further declines, it’s plausible to anticipate that the value won’t dip below the $140 range.
Gold, Silver Ready to Rally?
In the meantime, we’re keeping an eye on , waiting for it to move upward. If silver suddenly surges upwards, we should also brace for a rise in .
These two precious metals are typically closely correlated, but silver often outpaces gold.
Just think back to 2022, when gold climbed from the end of the year, reaching heights between $1800 and $2000 by May 2023 (levels akin to those seen in March 2022).
Similarly, over the same span, silver outperformed by over 30% since bottoming October 2022, then achieving year-long highs of $25.681 by May 2023.
Following that, there came a rotation away from precious metals.

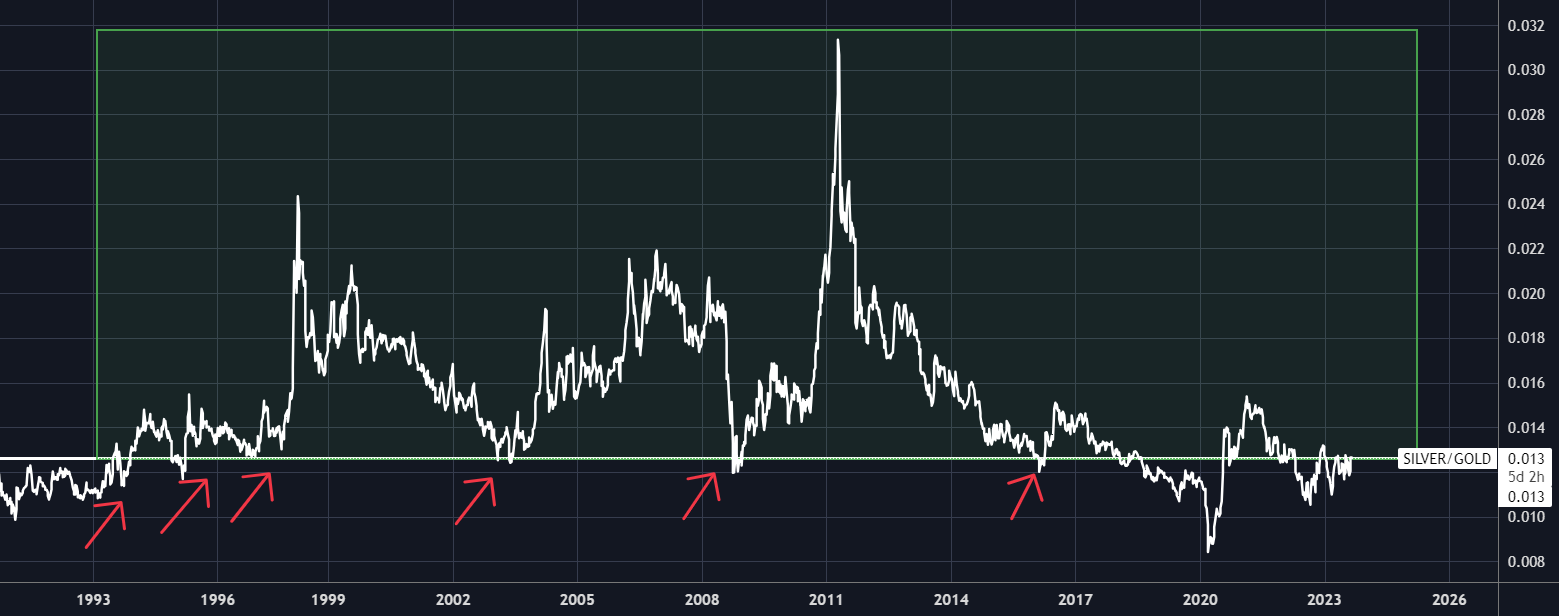
The 0.013 level in the silver-to-gold ratio holds significance as a crucial pivot point in the last decade, marking a key rotation level during bullish cycles.
Should silver make an upward breakthrough, it would signify an exceedingly positive advancement for “both” metals (as one often influences the other).
Independently, silver has maintained a consistent support level at $22.550. It’s worth noting that this doesn’t signify a downward trend.

Possibly, this time around, a fresh rally could potentially provide the necessary momentum for gold to surpass the previous highs, notably the $2070 resistance level.

Chinese Economy Nearing a Collapse?
Shifting our attention to China, a series of recent events have raised concerns about a potential collapse:
- Country Garden (OTC:) is teetering on the edge of default,
- Zhongzhi Enterprise Group is lagging behind on payments for high-yield investment products,
- has dipped to 3.7% year-on-year (falling short of the expected 4.3%), while retail sales are at 2.5% year-on-year (versus the projected 4.0%),
- Real estate sales have plummeted to -8.5% year-on-year (compared to -8.1%), and has risen to 5.3% (versus 5.2%), with youth unemployment hitting record highs,
- The banking system holds $12.9 trillion in public debt (constituting 29% of the total) and is exposed to 58 trillion yuan in real estate,
- The debt-to-GDP ratio stands at nearly 300%.
Moreover, the People’s Bank of China (PBOC) has interest rates, intensifying pressure on the depreciation of the yuan, its currency.
It’s hard not to think back to the alarm triggered by the devaluation in August 2015. It was a move that not only rattled global markets but also spurred a surge in as liquidity poured in.
Could history be on the brink of repeating itself?
***

Find All the Info you Need on InvestingPro!
Disclaimer: This article is written for informational purposes only; it does not constitute a solicitation, offer, advice, or recommendation to invest as such it is not intended to incentivize the purchase of assets in any way. I would like to remind you that any type of asset, is evaluated from multiple points of view and is highly risky and therefore, any investment decision and the associated risk remains with the investor.


