

ozgurdonmaz
In our previous analysis of Apple Inc. (NASDAQ:AAPL), we analyzed the smartphone market, projecting a -2.8% growth due to slow penetration rates and a global decrease in replacement rates. Despite this, we believed Apple was strategically positioned to thrive in the high-growth premium smartphone market. We identified the company’s competitive advantages in branding, product features, and breadth, leading us to project an average 4.1% growth in iPhone revenues.
In this review, we revisit the company post its FY2023 full-year results, revealing a 2.8% contraction in revenue growth, slightly below our full-year forecast of -0.7%. We examine the company to determine whether its revenue growth could pick up in FY2024 by reviewing its segments and outlook. Moreover, we examine whether the company’s margins could continue to increase with an expense analysis as analysts’ consensus projected higher EPS growth than revenue growth. Furthermore, we examine whether its EPS growth could be supported by stock buybacks by analyzing its FCFs.
Growth To Rebound but Lower Than Our Expectations
In this point, we examined whether Apple could achieve our previous expectations of a rebound in its total growth (12.64% in FY2024) following its poor performance last year.
|
Apple Revenue Segments ($ bln) |
Actual (2023) |
Our Previous Forecast (2024F) |
|
iPhone |
200.6 |
208.8 |
|
Growth % |
-2.39% |
4.10% |
|
Mac |
29.4 |
40.3 |
|
Growth % |
-26.94% |
37.30% |
|
iPad |
28.3 |
32.7 |
|
Growth % |
-3.38% |
15.70% |
|
Wearables, home and accessories |
39.8 |
45.3 |
|
Growth % |
-3.36% |
13.60% |
|
Services |
85.2 |
104.6 |
|
Growth % |
9.05% |
22.80% |
|
Total |
383.3 |
431.7 |
|
Total Growth % |
-2.80% |
12.64% |
Source: Company Data, Khaveen Investments.
In FY2023, the company’s revenue contracted by 2.8% as all of its segments had negative growth except for Services. We examine each segment’s performance in further detail below.
iPhone
In FY2023, Apple’s iPhone revenue dropped by 2.4% YoY as its total shipments declined by 5.4% based on IDC data, although its ASPs grew by 3.1%. As highlighted previously, the smartphone market demand waned due to weak consumer confidence, notably in China. Going forward, we expect the smartphone market growth in total to remain challenging with a forecasted average growth of -2.7% as the smartphone market matures with increasing upgrade cycles. However, we forecasted the premium smartphone market to be higher than the overall market at 2.5% in 2024 driven by higher spending. We expect Apple to capitalize on this due to its strong position in the premium market segment with a 75% share in 2022.
Recently, Apple introduced the iPhone 15 product lineup and highlighted in its briefing that it continues “to see extremely high levels of customer satisfaction which 451 Research recently measured at 98% in the U.S.” Additionally, Apple’s market share increased to 17.7% in Q3 2023 following the launch of its iPhone 15 compared to 17% in the same period last year, indicating its strong popularity.
The all-new iPhone 15 and iPhone 15 Plus feature a gorgeous design, powerful cameras and the intuitive Dynamic Island. Powered by the industry-leading A17 Pro, our iPhone15 Pro lineup has a beautiful strong and durable titanium design and the best iPhone camera system ever, including a 5X Telephoto lens on the iPhone 15 Pro Max. – Tim Cook, CEO.
However, Apple could be faced with tough competition from key players, especially Samsung Electronics Co., Ltd. (OTCPK:SSNLF) (16%) and Huawei (3%) who trail behind Apple in terms of market share in the premium segment. Notably, as we mentioned previously, Huawei’s new Mate model which has 5G capabilities has seen strong demand in China and was attributed to its rise in market share in China to 13% in Q3 2023 (9% a year ago), indicating strong consumer interest in its latest model. Moreover, Samsung is expected to announce its next flagship Samsung Galaxy model in early 2024.
IDC, Counterpoint Research, Khaveen Investments
Overall, for the iPhone segment, we continue to base our projections on a shipment growth forecast of 2.8% driven by premium smartphone market growth as we covered previously and ASP growth of 3.5% based on its 5-year average.
Mac
In FY2023, Apple’s Mac revenues declined by 27% in the full year as its total shipments declined by 12% YoY amid the weak PC market shipments growth, which we previously forecasted to decline by 11.7% for the full year due to excess shipments following the pandemic period. However, we expected the PC market to recover strongly in 2024 at 18.7% as we modeled excess shipments to be fully absorbed. Furthermore, another reason for the decline in Apple Mac revenues is due to ASP declines of 17%. This is because Apple had cut prices for some of its new MacBook models such as its MacBook Air by $100, which is a decline of 8.3% from the original price of $1,199.
Gartner, Khaveen Investments
In 2023, Apple released new M3 chips and with performance improvement compared to its successors highlighted below by Digital Trends.
On the CPU side, Apple increased the speed of its performance cores by 15% and its efficiency cores by 30% over the M2. Overall, Apple is promising a 20% to 25% improvement in performance. On the GPU side, Dynamic Caching is one technology that speeds up a variety of GPU processes, while gamers will benefit from mesh shading and hardware-accelerated ray tracing. – Digital Trends.
|
Company |
Notebook |
Desktop |
Average PassMark CPU Score |
|
Intel Corporation (INTC) |
33,585 |
38,862 |
36,224 |
|
Advanced Micro Devices, Inc. (AMD) |
21,466 |
45,367 |
33,417 |
|
Apple Inc. |
29,397 |
29,397 |
29,397 |
Source: PassMark, Khaveen Investments.
However, comparing the average CPU benchmark score for Apple’s M3 with our previous analysis of AMD and Intel 2022 gen CPU scores, we see Apple’s Notebook average score higher than AMD but lower than Intel. However, its Desktop scores are well below Intel and AMD. Thus, we believe Apple continues to lack a solid performance advantage as we determined previously and limits its ASP growth. Nonetheless, Apple highlighted that it continues “to see strong upgraded activity to Apple silicon” and high “customer satisfaction at 96% for Mac.” For the Mac segment, we update our forecast of its shipment growth based on our PC market projections which show a strong recovery in 2024 by 18.7% due to we estimate the market excess shipments fully absorbed as explained in our Intel analysis, as well as ASP growth based on its 5-year average of -1%, as we see its pricing power limited due to a lack of a solid performance advantage despite its new M3 chips.
iPad
For its iPad segment, its revenues declined by 3.4% as its shipments declined by 0.7%. According to management, iPad revenue challenges were attributed to challenging market conditions, including supply disruptions (factory shutdowns during the previous year’s June quarter) and difficult compares from the previous year. Though, Apple’s market share was fairly stable in the period. Furthermore, according to the IDC, the tablet market is forecasted to grow by 4.4% YoY in 2024 as demand improves and excess inventory is expected to ease.
IDC, Khaveen Investments
In Q1 2023, Apple introduced new iPad and M2-iPad Pro models and highlighted the positive customer reception for versatility and design. The company also emphasized high customer satisfaction “measured at 98% in the U.S. by 451 Research.” Furthermore, Apple is expected to be launching new iPad Air models in 2024 which are expected to offer new features and improved performance as highlighted by ZDNet.
The OLED display for the new Pro versions will adopt the Tandem design with LTPO (low-temperature polycrystalline oxide) backplanes, the same backplanes used on the iPhone 15 Pro phones. That means the new OLED tablets will outshine the existing LED and mini-LED models in both display performance and power consumption. – ZDNet.
Overall, we forecast its shipment growth based on the tablet market forecast CAGR of 0.3% and ASP growth at a 3-year average of -4.2% as we see Apple continuing to maintain its competitiveness and market position with more attractive pricing.
Wearables, Home, and Accessories
Apple’s Wearables, Home, and Accessories segment revenues declined by 3.4% YoY in 2023. The segment consists primarily of its AirPods and Apple Watch revenues, which represent around 43% of revenues each based on our estimates in 2023.
Canalys, Khaveen Investments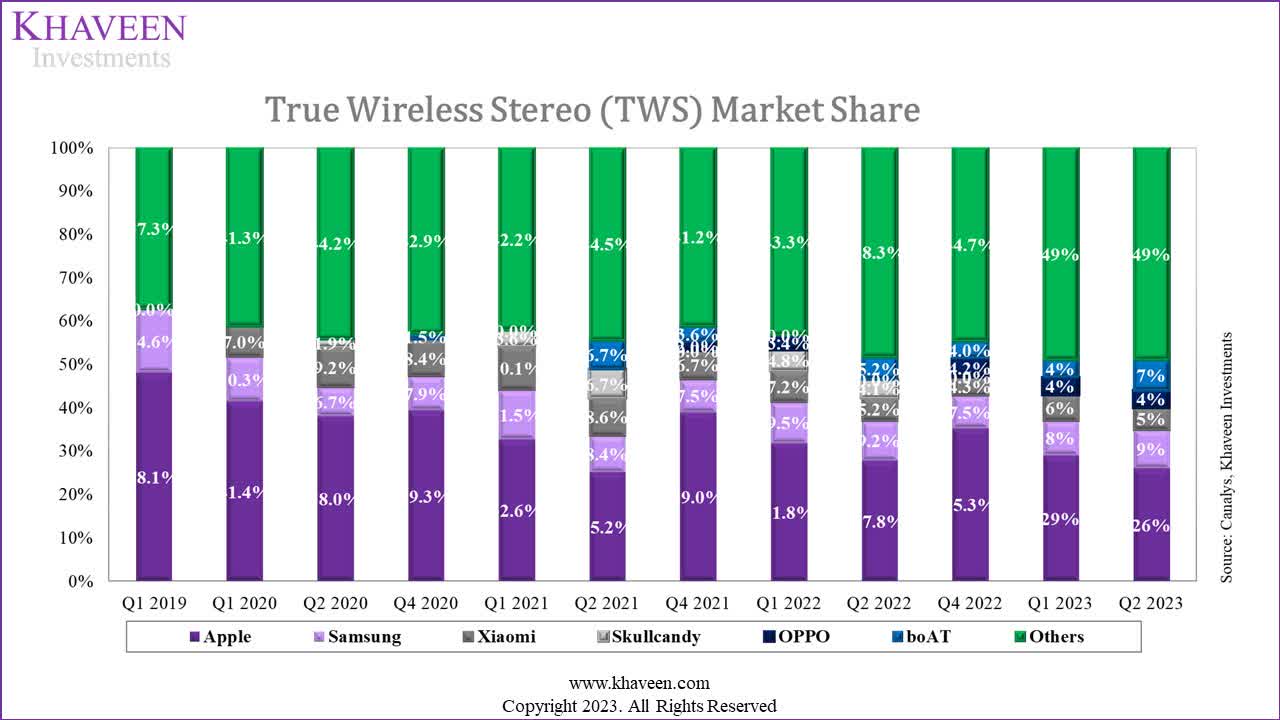
In wireless headphones (AirPods), we estimate its shipments decline by 9.2% based on its prorated Q1 and Q2 shipment growth by Canalys. Moreover, as seen by the chart above of TWS market share shipments, Apple has been on a declining trend while the share of Others has been increasing over the past 5 years. This highlights competition risks for the company. According to Canalys, “vendors are facing fierce competition and are struggling to differentiate from their rivals.” Additionally, smaller new entrants are increasingly becoming more competitive such as boAT based in India, having the largest population, and being the market leader there.
Canalys, Counterpoint Research, Khaveen Investments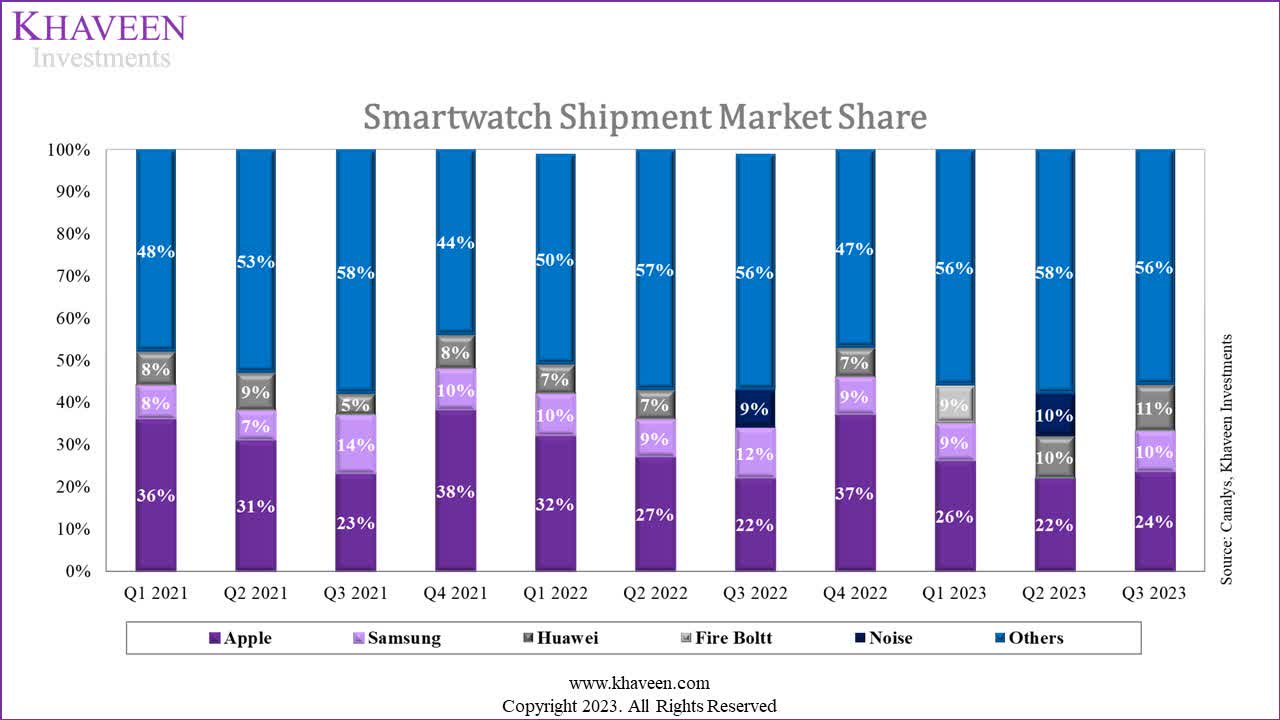
Similarly, Apple’s market share of smartwatches has been decreasing over the past 3 years and we estimated its shipments to decline by 2% in 2023 based on its market share growth and smartwatch market shipment growth of 11% YoY. Counterpoint Research highlighted that Apple’s decline is attributable to its “higher-priced Apple Watches” amid the weak consumer environment. For example, while Apple’s market share decreased, competitor Fire Bolt saw its share gain over the period with a cheaper price range of around $20 to 45 for its smartwatches compared to an average of $396 for Apple. Though, Apple recently launched several new Apple Watch models with improved features and highlighted its strongest lineup ever for its smartwatches. Also, Apple highlighted that the majority of its buyers are new at “2/3 of every buyer of Apple Watch.”
Apple Watch has become essential in our lives and this is our best Apple Watch lineup ever. With the Apple Watch Series 9 and Apple Watch Ultra 2, we’re giving people even more tools to stay safe and live healthy, active lives. With the new double tap gesture, users can easily control the Apple Watch Series 9 and Apple Watch Ultra 2 using just one hand and without touching the display. – Tim Cook, CEO.
In total, for its Wearables, home and accessories segment, we forecast its growth based on the smartwatch, TWS and smart speaker market forecast CAGR, but accounted for further market share losses, at a weighted average of 10.2%.
Services
Finally, Services revenue also slowed down in 2023 at a 9% YoY growth. According to its earnings briefings, management highlighted the challenging “macroeconomic environment” which impacted the segment growth. We updated our derived breakdown of the Services segment below and projections.
|
Apple Services Forecast ($ mln) |
2021 |
2022 |
2023 |
2024F |
2025F |
2026F |
Our Previous Forecast Average |
Our New Forecast Average |
|
App Store |
19,148 |
19,530 |
20,025 |
22,995 |
26,410 |
30,337 |
||
|
Growth % |
2.0% |
2.5% |
14.8% |
14.9% |
14.9% |
23.4% |
14.9% |
|
|
Apple Music |
8,488 |
9,337 |
11,646 |
13,023 |
14,566 |
16,294 |
||
|
Growth % |
10.0% |
24.7% |
11.8% |
11.8% |
11.9% |
44.1% |
11.8% |
|
|
Apple TV |
1,497 |
2,339 |
4,422 |
5,574 |
6,747 |
7,956 |
||
|
Growth % |
56.3% |
89.1% |
26.0% |
21.0% |
17.9% |
27.5% |
21.7% |
|
|
Apple News+ |
1,424 |
1,319 |
1,470 |
1,638 |
1,826 |
2,036 |
||
|
Growth % |
-7.4% |
11.4% |
11.5% |
11.5% |
11.5% |
18.3% |
11.5% |
|
|
Other Services Revenue |
37,870 |
45,605 |
47,637 |
52,344 |
57,524 |
63,228 |
||
|
Growth % |
20.4% |
4.5% |
9.9% |
9.9% |
9.9% |
8.7% |
9.9% |
|
|
Total Service Revenue |
68,427 |
78,130 |
85,200 |
95,574 |
107,074 |
119,851 |
||
|
Growth % |
14.2% |
9.0% |
12.2% |
12.0% |
11.9% |
22.9% |
12.0% |
|
|
Our Previous Forecast |
22.8% |
22.7% |
23.0% |
Source: Company Data, Business of Apps, Khaveen Investments.
In 2023, its Services revenue growth is lower across Apple TV and Other Services revenue which consist of products such as Apple Licensing, Apple Care and iCloud. However, Apple had raised pricing for some of its Services products such as Apple Music and Apple TV by 8.7% and 40.1% respectively in 2023 which supported its growth. We updated our previous forecasts for its Services segment. In total, we derived a forward average of 12%, lower than the high growth of 22.9% previously. This is due to:
- For its App Store revenue, we forecast it to be lower (14.9% vs 23.4% previously) on average based on its 5-year average App revenue per user growth (4.5% vs 13.6% previously) multiplied with our Apple installed base growth projections of 9.9% for a total of 14.9%. According to BusinessofApps, App Store revenues had stagnated in the past 2 years as revenue from Gaming apps had plateaued in the past 2 years with a growth rate of -4.3% amid the gaming market slowdown. Gaming is the largest app category in the App Store accounting for 58% of total app revenue in 2022.
- Moreover, for its Apple Music revenue, we update our projections with a forward average of 11.8% compared to 44.1% as its subscriber growth had slowed down over the past 3 years and we forecast its new subscriber growth at 11.8% (44% previously), which is more in line with its past 3-year subscriber growth at an average of 12%.
- Additionally, for its Apple News revenue, we updated our forecast for its subscriber growth with an average of 11.5%, compared to our previous forecast of an average of 18% as its subscriber growth had moderated in the past 3 years (4% average).
- Though, for its Apple TV segment, our forecast is in line with our previous projections as its subscriber growth remained strong in 2022 at 56%.
- For Other Services revenue, we updated it based on our revised projections of its installed base at 9.9%, which is in line with our previous projection of 8.7% on average.
Outlook
|
Apple Revenue Projections ($ mln) |
2023 |
2024F |
2025F |
2026F |
Our Previous Forecast (2024F) |
|
iPhone |
200.6 |
213.38 |
227.00 |
241.48 |
208.8 |
|
Growth % |
-2.4% |
6.4% |
6.4% |
6.4% |
4.10% |
|
Mac |
29.4 |
34.50 |
36.69 |
37.06 |
40.3 |
|
Growth % |
-26.9% |
17.5% |
6.3% |
1.0% |
37.30% |
|
iPad |
28.3 |
27.20 |
26.14 |
25.13 |
32.7 |
|
Growth % |
-3.4% |
-3.9% |
-3.9% |
-3.9% |
15.70% |
|
Wearables, home and accessories |
39.8 |
44.03 |
48.50 |
53.25 |
45.3 |
|
Growth % |
-3.4% |
10.5% |
10.2% |
9.8% |
13.60% |
|
Services |
85.2 |
95.57 |
107.07 |
119.85 |
104.6 |
|
Growth % |
9.0% |
12.2% |
12.0% |
11.9% |
22.80% |
|
Total |
383.3 |
414.7 |
445.4 |
476.8 |
431.7 |
|
Total Growth % |
-2.8% |
8.2% |
7.4% |
7.0% |
12.64% |
Source: Company Data, Khaveen Investments.
In summary, we adjusted our revenue projections and presented a summarized overview in the table above. In total, we see the company’s growth slightly lower at 8.2% in 2024 (vs 12.6% previously). One of the primary factors is due to the lower projections for its Services segment, it’s second largest segment (22% of total revenue), which we previously forecasted to grow by a lower growth rate of 12.2% (vs 22.8% previously) due to lower growth across App Store which had been impacted by lower spending on Gaming apps, lower Apple Music subscriber growth projections as it had slowed down in the past 3 years indicating it could be approaching a more matured growth cycle. Moreover, our lower and tapered-down Mac and iPad projections also weigh on our total growth forecast of Apple as we highlighted its limited pricing power due to a lack of a solid performance advantage despite its new chips and fierce competition in the tablet market, resulting in aggressive pricing cuts by Apple.
Stable and Flattish Margin Outlook
In the next point, we focused on Apple’s profitability and margin growth outlook. As seen in the chart below, its P/E ratio has been on an increasing trend over the past 10 years.
YCharts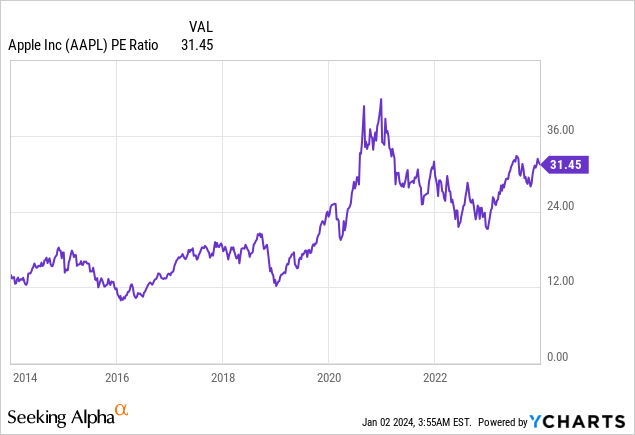
SeekingAlpha
SeekingAlpha
One of the factors for its rising P/E trend could be marginal growth expectations. The consensus among analysts indicates an anticipated higher growth in the company’s EPS compared to its revenue. Thus, we examined whether the company’s profit margins could rise going forward.
Company Data, Khaveen Investments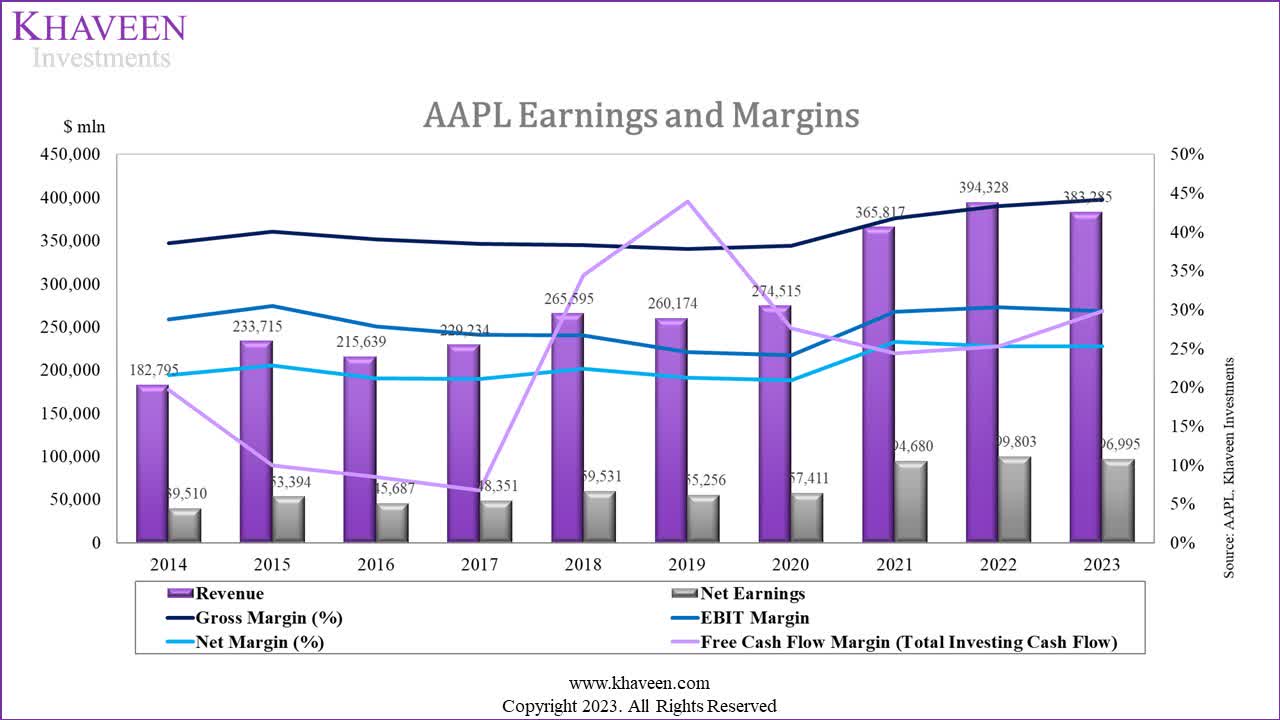
Over the past 10 years, the company’s net margins have increased, with a notable rise in 2021 as its gross margins rose. However, its net margins were flat. We examine the company’s key expenses trend as a % of revenue with an expense analysis below.
Company Data, Khaveen Investments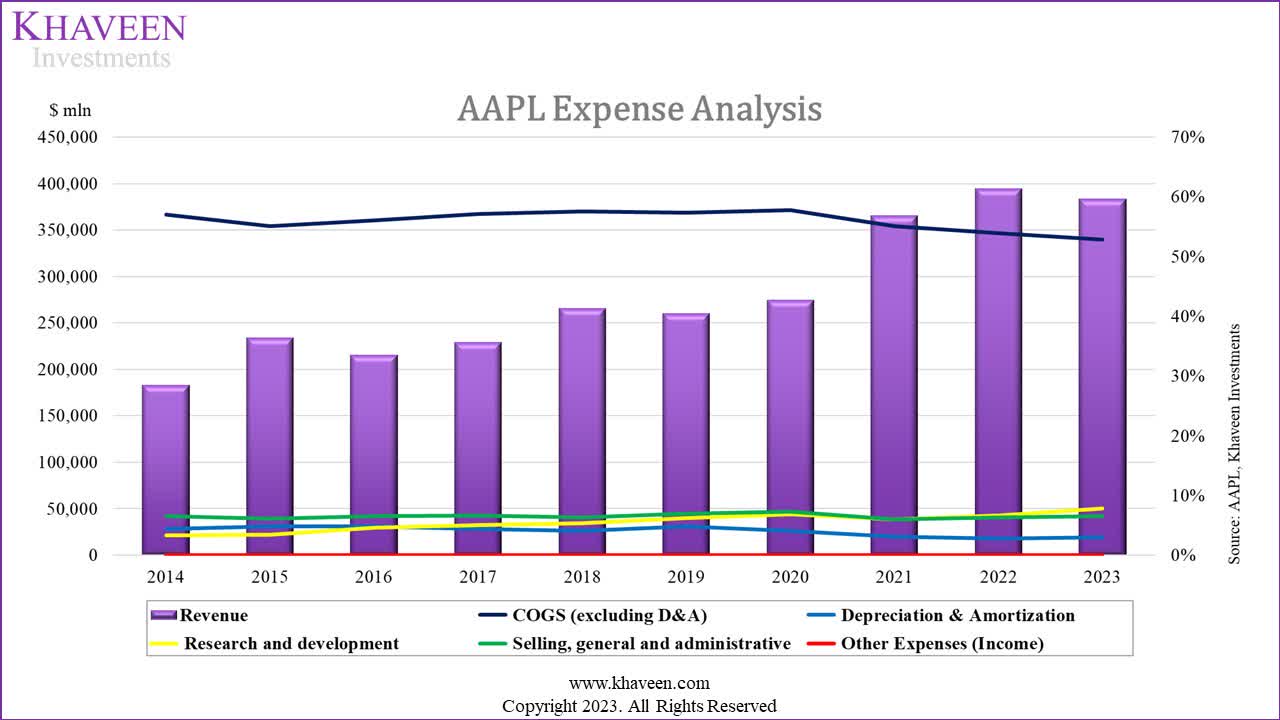
|
Expense Analysis (% of Revenue) |
2014 |
2015 |
2016 |
2017 |
2018 |
2019 |
2020 |
2021 |
2022 |
2023 |
Average |
|
COGS (excluding D&A) |
57.1% |
55.1% |
56.1% |
57.1% |
57.6% |
57.4% |
57.7% |
55.1% |
53.9% |
52.9% |
56.0% |
|
Depreciation & Amortization |
4.3% |
4.8% |
4.9% |
4.4% |
4.1% |
4.8% |
4.0% |
3.1% |
2.8% |
3.0% |
4.0% |
|
Gross Profit |
38.6% |
40.1% |
39.1% |
38.5% |
38.3% |
37.8% |
38.2% |
41.8% |
43.3% |
44.1% |
40.0% |
|
Research and development |
3.3% |
3.5% |
4.7% |
5.1% |
5.4% |
6.2% |
6.8% |
6.0% |
6.7% |
7.8% |
5.5% |
|
Selling, general and administrative |
6.6% |
6.1% |
6.6% |
6.7% |
6.3% |
7.0% |
7.3% |
6.0% |
6.4% |
6.5% |
6.5% |
|
Other Expenses (Income) |
0.0% |
0.0% |
0.0% |
0.0% |
0.0% |
0.0% |
0.0% |
0.0% |
0.0% |
0.0% |
0.0% |
|
Earnings Before Interest & Taxes (EBIT) |
28.7% |
30.5% |
27.8% |
26.8% |
26.7% |
24.6% |
24.1% |
29.8% |
30.3% |
29.8% |
27.9% |
|
Interest |
-0.8% |
-0.9% |
-1.2% |
-1.3% |
-0.9% |
-0.5% |
-0.3% |
-0.1% |
0.03% |
0.05% |
-0.6% |
|
Other non-operating expenses (income) |
0.2% |
0.4% |
0.6% |
0.1% |
0.2% |
-0.2% |
0.0% |
0.0% |
0.1% |
0.1% |
0.1% |
|
Earnings Before Tax |
29.3% |
31.0% |
28.5% |
28.0% |
27.4% |
25.3% |
24.4% |
29.9% |
30.2% |
29.7% |
28.4% |
|
Tax |
7.6% |
8.2% |
7.3% |
6.9% |
5.0% |
4.0% |
3.5% |
4.0% |
4.9% |
4.4% |
5.6% |
|
Net Earnings |
21.6% |
22.8% |
21.2% |
21.1% |
22.4% |
21.2% |
20.9% |
25.9% |
25.3% |
25.3% |
22.8% |
Source: Company Data, Khaveen Investments.
- COGS: COGS % of revenue had been increasing from 2014 up to 2020. However, after 2020, it has been declining every year, from 57.7% to 52.9%.
- D&A: Before 2020, its D&A % of revenue had remained stable consistently at an average of 4.5%. Its D&A % of revenue after 2020 declined to 3% with a past 3 years average of 3%.
- R&D: There has been an upward trend in R&D over the past ten years, increasing from 3.3% in 2014 to 7.8% in 2023. Notably, 2023 is also the year with the highest R&D in this period.
- SG&A: Its SG&A % of revenue has been very stable with a past 10-year average of 6.5%.
- Interest: Its interest expense % of revenue was negative until 2021 as its interest income was higher than its interest expenses. However, from 2022 onwards, its interest expense % of revenue increased but only represented a minor portion or 0.05% of revenue.
- Other non-operating expense (income): Its Other non-operating expense also contributed a minor portion to its expenses at only 0.1% in 2023 with a 10-year average of 0.1%
- Tax: Its tax expenses % of revenue had gradually declined as a % of revenue but had stabilized in the past 5 years with an average of 4.2%.
We discussed the two major expenses including COGS, which is its largest expense item, as well as R&D which increased to its highest in the past 10 years.
COGS
Previously, we forecasted its COGS by first forecasting its total gross margins, which were based on our projections for its Products and Services segments.
- For its Products segment, we forecasted its margin to increase based on its 5-year average increase of 0.1%
- Services segment, we forecasted it by estimating its costs (cost per installed base multiplied by installed base forecasts), subtracted from our Services revenue forecasts.
Based on our total weighted average gross margins, we subtracted our forecasted depreciation to derive our COGS estimates and divided it with our revenue projections to estimate its COGS % of revenue. In total, we forecasted its COGS % of revenue to decline from 53.1% to 46.7% by 2026 as we previously explained due to its Services segment that has higher growth and margins than Products.
|
Apple Gross Margins by Segment |
2017 |
2018 |
2019 |
2020 |
2021 |
2022 |
2023 |
Average |
|
Product Revenue ($ bln) |
199.3 |
227.1 |
213.9 |
220.8 |
297.4 |
316.2 |
298.1 |
|
|
Product COGS Estimate ($ bln) |
119.3 |
139.7 |
134.7 |
142.3 |
183.3 |
192.5 |
180.6 |
|
|
Product Depreciation Estimate ($ bln) |
8.8 |
9.3 |
10.3 |
8.9 |
9.2 |
8.9 |
9.0 |
|
|
Product Gross Margin |
35.7% |
34.4% |
32.2% |
31.5% |
35.3% |
36.3% |
36.4% |
34.5% |
|
Product Revenue % of Total |
86.9% |
85.5% |
82.2% |
80.4% |
81.3% |
80.2% |
77.8% |
|
|
Services Revenue ($ bln) |
30.0 |
38.5 |
46.3 |
53.8 |
68.4 |
78.1 |
85.2 |
|
|
Services COGS Estimate ($ bln) |
12.2 |
13.5 |
14.6 |
16.1 |
18.6 |
19.9 |
22.0 |
|
|
Services Depreciation Estimate ($ bln) |
1.3 |
1.6 |
2.2 |
2.2 |
2.1 |
2.2 |
2.6 |
|
|
Services Gross Margin |
55.0% |
60.8% |
63.7% |
66.0% |
69.7% |
71.7% |
71.2% |
65.4% |
|
Services Revenue % of Total |
13.1% |
14.5% |
17.8% |
19.6% |
18.7% |
19.8% |
22.2% |
|
|
Total Revenue ($ bln) |
229.2 |
265.6 |
260.2 |
274.5 |
365.8 |
394.3 |
383.3 |
|
|
Total COGS ($ bln) |
130.9 |
152.9 |
149.2 |
158.5 |
201.7 |
212.4 |
202.6 |
|
|
Total D&A ($ bln) |
10.2 |
10.9 |
12.5 |
11.1 |
11.3 |
11.1 |
11.5 |
|
|
Total Gross Margin |
38.5% |
38.3% |
37.8% |
38.2% |
41.8% |
43.3% |
44.1% |
40.3% |
Source: Company Data, Khaveen Investments.
As seen by the gross margin breakdown above, its Products gross margin decreased until 2020 and started rising in 2021. In 2023, its Product margins increased to the highest in the period. Moreover, the company’s Service gross margin had increased until 2022 and was 71.2% in 2023.
Based on the company’s annual report, the decrease in gross margins for its Services segment in 2022 was due to the weakening of foreign currencies relative to the US dollar. All of its reportable geographic segments experienced weaker foreign currencies compared to the US dollar in 2023. The company highlighted the risk of choosing not to raise its international pricing in the event of weakening foreign currencies for competitive reasons that may affect its gross margins.
Going forward, we forecast the company’s COGS % of revenue by forecasting its COGS by Products and Services segments. For Products, we forecast its total COGS based on our projections of its total Products shipment growth of smartphones, PCs, tablets and wearables and average cost per shipment growth. Whereas for its Services segment, we forecast its total COGS based on our projections of its installed base and cost per installed base growth.
|
Margins |
2018 |
2019 |
2020 |
2021 |
2022 |
2023 |
2024F |
2025F |
2026F |
|
Product Segment |
|||||||||
|
Revenue |
227.1 |
213.9 |
220.8 |
297.4 |
316.2 |
298.1 |
319.1 |
338.3 |
356.9 |
|
Growth % |
14.0% |
-5.8% |
3.2% |
34.7% |
6.3% |
-5.7% |
7.1% |
6.0% |
5.5% |
|
Gross Profit |
78.1 |
68.9 |
69.5 |
105.0 |
114.8 |
108.6 |
116.6 |
124.0 |
131.3 |
|
Gross Margin % |
34.4% |
32.2% |
31.5% |
35.3% |
36.3% |
36.4% |
36.54% |
36.66% |
36.78% |
|
COGS |
149.0 |
145.0 |
151.2 |
192.4 |
201.4 |
189.5 |
202.98 |
216.37 |
230.06 |
|
iPhone Shipment (mln) |
217.7 |
185.2 |
189.8 |
239.9 |
237.1 |
223.6 |
229.9 |
236.3 |
242.9 |
|
iPad Shipments (mln) |
43.6 |
45.1 |
50.1 |
59.3 |
56.7 |
56.3 |
56.5 |
56.6 |
56.8 |
|
Mac Shipment (mln) |
18.3 |
18.4 |
20.8 |
26.9 |
27.4 |
23.4 |
27.8 |
29.8 |
30.4 |
|
Wearables (mln) |
61.7 |
96.6 |
166.9 |
145.9 |
149.5 |
139.8 |
154.7 |
170.8 |
188.3 |
|
Total shipments (mln) |
341.3 |
345.2 |
427.6 |
472.0 |
470.7 |
443.1 |
468.8 |
493.6 |
518.4 |
|
Average cost per product |
436.56 |
420.05 |
353.62 |
407.68 |
427.96 |
427.76 |
433.03 |
438.36 |
443.75 |
|
Growth % |
3.8% |
-3.8% |
-15.8% |
15.3% |
5.0% |
0.0% |
1.23% |
1.23% |
1.23% |
|
Services Segment |
|||||||||
|
Revenue |
38.5 |
46.3 |
53.8 |
68.4 |
78.1 |
85.2 |
95.6 |
107.1 |
119.9 |
|
Growth % |
28.3% |
20.4% |
16.2% |
27.2% |
14.2% |
9.0% |
12.2% |
12.0% |
11.9% |
|
Gross Profit |
23.4 |
29.5 |
35.5 |
47.7 |
56.0 |
60.3 |
68.0 |
76.4 |
85.8 |
|
Gross Margin % |
60.8% |
63.7% |
66.0% |
69.7% |
71.7% |
70.8% |
71.1% |
71.3% |
71.6% |
|
COGS ($ mln) |
15.1 |
16.8 |
18.3 |
20.7 |
22.1 |
24.9 |
27.6 |
30.7 |
34.1 |
|
Total installed base (bln) |
1.4 |
1.5 |
1.7 |
1.8 |
2.0 |
2.2 |
2.4 |
2.7 |
2.9 |
|
Cost per installed base |
0.011 |
0.011 |
0.011 |
0.012 |
0.011 |
0.011 |
0.011 |
0.012 |
0.012 |
|
Growth % |
3.8% |
4.0% |
-1.1% |
3.9% |
-4.0% |
2.4% |
1.05% |
1.05% |
1.05% |
|
Product COGS |
149.0 |
145.0 |
151.2 |
192.4 |
201.4 |
189.5 |
203.0 |
216.4 |
230.1 |
|
Services COGS |
15.1 |
16.8 |
18.3 |
20.7 |
22.1 |
24.9 |
27.6 |
30.7 |
34.1 |
|
COGS (Total) |
164.1 |
161.8 |
169.5 |
213.2 |
223.5 |
214.4 |
230.6 |
247.0 |
264.1 |
|
Depreciation |
10.9 |
12.5 |
11.1 |
11.3 |
11.1 |
11.5 |
11.8 |
11.8 |
11.8 |
|
COGS (Excluding D&A) |
153.2 |
149.3 |
158.4 |
201.9 |
212.4 |
202.9 |
218.8 |
235.2 |
252.4 |
|
COGS % of revenue |
57.7% |
57.4% |
57.7% |
55.2% |
53.9% |
52.9% |
52.8% |
52.8% |
52.9% |
Source: Company Data, Khaveen Investments.
As seen above, for its Products segment, its average cost per product had decreased significantly in 2020 as its Wearables shipments increased due to the launch of its new AirPods and increased following the surge in iPhone shipments in the following year of 2021. We forecast its average cost per shipment based on its 6-year average excluding both these years. Furthermore, for its Services segment, we updated our previous forecast of its COGS based on our installed base growth projections for the company and average cost per installed base based on a 6-year average growth. Then, we summed our total COGS estimates for both segments and subtracted our depreciation forecasts to derive our COGS % revenue estimates which show it fairly stable with a slight increase to 53.5% by 2026.
R&D
In terms of R&D, we previously projected based on its 2022 % of the revenue of 6.7% as it has reached the highest in the past 10 years. According to management, the increase in R&D spending is driven by factors such as Vision Pro, AI and ML, Apple Silicon and Mac transition. Furthermore, the company stated that some R&D investments contribute to gross margin expansion. Additionally, management stated that it plans continued investment in R&D with a focus on innovation and product development. According to MacRumors, there are several anticipated product launches in 2024 such as the M3 Mac, Apple Vision Pro, OLED display Mac models and new AirPods Pro. Beyond that, one of the future product developments is the Apple Car called “Project Titan” which is expected to be launched between 2023 and 2025.
Outlook
Overall, we updated our forecast for the company’s margins with our assumptions for its expenses such as:
- COGS: We estimated it to be fairly stable with an estimated % of revenue of 53.5% by 2026 based on our estimates of its COGS by Products and Services excluding D&A as explained above.
- D&A: We previously forecasted this based on its 5-year average depreciation & amortization % of fixed assets of 5.7%. We continued to forecast it with a 5-year average of 5.7% as it was stable in the period.
- R&D: We expect its R&D % of revenue to continue rising as it focuses on upcoming product developments such as its Apple Silicon, new product models and future product development such as Apple Car and forecasted to increase by 0.5% per year.
- SG&A: We previously projected it based on its past 5-year average of 6.6%. In our previous analysis, we highlighted the company’s branding strength as the top among all smartphone competitors. Thus, we continue to base our assumption on the same method. Thus, we expect it to continue remaining stable and forecast a 5-year average of 6.63%.
- Interest: We previously projected it based on a 5-year average interest expense as % of revenue 0.17% and maintained our forecast as it has been stable in the period.
- Other non-operating expense (income): We previously did not account for this in our forecast and now forecast it with a 5-year average of 0.002%.
- Tax: We previously forecasted based on its 5-year average tax expenses as % of EBT of 15.2% and continue to forecast in this way as it has been stable.
Company Data, Khaveen Investments
|
Our Previous Forecasts |
2024F |
2025F |
2026F |
|
Product Gross Margin |
36.42% |
36.54% |
36.66% |
|
Services Gross Margin |
70.69% |
73.57% |
76.23% |
|
Gross Margin |
45.20% |
47.07% |
49.20% |
|
EBIT Margin |
31.91% |
33.79% |
35.92% |
|
Net Margin |
27.11% |
28.69% |
30.49% |
|
Our New Forecasts |
2024F |
2025F |
2026F |
|
Product Gross Margin |
36.54% |
36.66% |
36.78% |
|
Services Gross Margin |
71.10% |
71.35% |
71.57% |
|
Company Gross Margin |
44.39% |
44.53% |
44.60% |
|
EBIT Margin |
29.96% |
29.60% |
29.17% |
|
Net Margin |
25.53% |
25.24% |
24.87% |
Source: Company Data, Khaveen Investments.
In comparison with our previous forecasts, we modeled lower margins for the company. We modeled its gross margins to only increase to 44.6% by 2026 (vs 49.2% previously). This is due to the higher COGS % of revenue of 52.9% compared to 46.7% previously. One of the main reasons for this is due to our lower forecasts of its higher-margin Services segment as we modeled its Services segment margin to only increase to 71.6% (vs 76.23% previously) mainly due to the slowdown in growth for the segment.
In our previous analysis, we believed the robust growth of its Services segment with higher margins primarily affected Apple’s overall margin growth, however, our revised projections now indicate slower growth for Services, impacting our outlook on Apple’s total margin growth. Additionally, we believe Apple’s pipeline of future innovative projects could further affect its profitability as we forecast its R&D spending % of revenue for the company by 0.5% per year, impacting its net margins. Thus, we now expect Apple’s net margins to remain fairly stable and flattish going forward, rather than increasing slightly in our previous analysis.
Huge Cash Pile Supports Stock Buybacks
Moreover, we examined the company’s FCF generation abilities, by analyzing its business model and capex requirements, and how it could further support its stock repurchases going forward.
Company Data, Khaveen Investments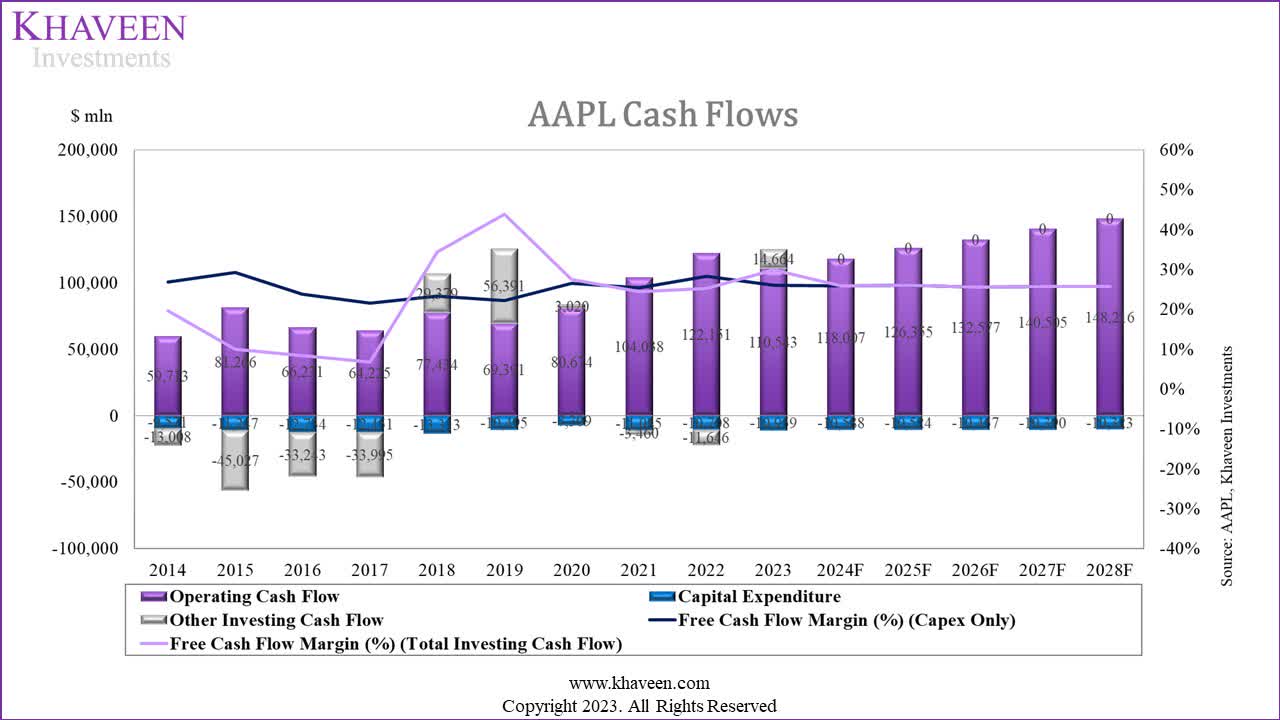
Based on the chart, the company’s FCF margins stable (based on capex only excluding other investing cash flow) have been very with an average of 25.3% in comparison with its FCF margins based on total investing cash flows with an average of 23.04%. Its FCF margins based on total investing cash flows are more volatile due to the company’s investments in marketable securities. For example, in 2023, it had a positive other investing cash flow as its proceeds from marketable securities were higher than its total spent. To examine Apple’s FCF generation strength, we examined its capex in the table below.
Capex
|
Apple Investing Cash Flow Analysis |
2014 |
2015 |
2016 |
2017 |
2018 |
2019 |
2020 |
2021 |
2022 |
2023 |
Average |
|
Capex |
9,571 |
11,247 |
12,734 |
12,451 |
13,313 |
10,495 |
7,309 |
11,085 |
10,708 |
10,959 |
|
|
Capex % of Revenue |
5.2% |
4.8% |
5.9% |
5.4% |
5.0% |
4.0% |
2.7% |
3.0% |
2.7% |
2.9% |
4.2% |
|
Capex % Fixed Assets |
5.9% |
5.6% |
5.9% |
5.0% |
5.7% |
6.0% |
4.1% |
5.1% |
4.9% |
5.2% |
5% |
|
Other Investing Cash Flow |
13,008 |
45,027 |
33,243 |
33,995 |
-29,379 |
-56,391 |
-3,020 |
3,460 |
11,646 |
-14,664 |
|
|
Other Investing Cash Flow % of Revenue |
7.1% |
19.3% |
15.4% |
14.8% |
-11.1% |
-21.7% |
-1.1% |
0.9% |
3.0% |
-3.8% |
2.3% |
|
Free Cash Flow Margin (%) (Capex Only) |
26.82% |
29.22% |
23.88% |
21.59% |
23.41% |
22.22% |
26.47% |
25.37% |
28.28% |
26.02% |
25.3% |
|
Free Cash Flow Margin (%) (Total Investing Cash Flow) |
19.70% |
9.95% |
8.46% |
6.76% |
34.48% |
43.89% |
27.57% |
24.42% |
25.33% |
29.85% |
23.0% |
Source: Company Data, Khaveen Investments.
As seen above, the company’s total capex % of revenue is low with an average of only 4.2%. Moreover, the company’s capex % of revenue had declined slightly, especially in 2020 and stabilized with an average of 2.8% of revenue. Additionally, in terms of the capex % of fixed assets, it is also very stable with an average of 5% in the period. We believe the reason for the company’s low capex is that according to its annual report, its manufacturing is performed by outsourcing partners globally, particularly in Asia. According to BCG, “Apple became asset-light in the late 1990s when Tim Cook, then the chief operating officer, outsourced almost all production.” For example, Foxconn is Apple’s “main contractor for the production of a wide range of products, including iPhones and MacBooks.” Foxconn is the market leader in EMS with a share of 41%. In comparison, other Foxconn customers within the Tech Hardware industry also have low capex such as HP Inc. (HPQ) (1% of revenue), Dell Technologies Inc. (DELL) (2.9%) and Sony Group Corporation (SONY) (5%). Therefore, we based our assumptions for its FCF based on its 5-year average % of fixed assets of 5%. Furthermore, we assumed its days receivable and inventory based on its 5-year average and payables based on its 3-year average as it had been stable in the period.
Stock Buybacks
|
Apple Stock Repurchases |
2014 |
2015 |
2016 |
2017 |
2018 |
2019 |
2020 |
2021 |
2022 |
2023 |
Average |
|
Apple Stock Repurchases ($ mln) |
46,158 |
36,752 |
31,292 |
34,774 |
75,265 |
69,714 |
75,992 |
92,527 |
95,625 |
82,981 |
64,108 |
|
Apple Average Stock Price |
20.48 |
27.10 |
24.10 |
35.34 |
45.06 |
50.42 |
93.40 |
139.03 |
153.53 |
170.66 |
75.91 |
|
Average Shares Outstanding (mln) |
24,491 |
23,172 |
22,001 |
21,007 |
20,000 |
18,596 |
17,528 |
16,865 |
16,326 |
15,813 |
19,580 |
|
Average Market Cap ($ bln) |
502 |
628 |
530 |
742 |
901 |
938 |
1,637 |
2,345 |
2,506 |
2,699 |
1,486 |
|
Stock Repurchase % of Market Cap |
9.2% |
5.9% |
5.9% |
4.7% |
8.4% |
7.4% |
4.6% |
3.9% |
3.8% |
3.1% |
4.3% |
Source: Company Data, Khaveen Investments.
With its strong FCFs, Apple capitalizes on it with stock repurchases. As seen above, its average yearly spending on stock repurchases is $64 bln. Its shares outstanding have been decreasing in the past 10 years. Its average stock repurchases as % of the market cap had been 4.3%. Management also recently highlighted its “goal of becoming net cash-neutral over time remains unchanged” and had previously mentioned in Q2 that they “continue to believe there is great value” in the company’s stock.
Company Data, Khaveen Investments
As seen by the chart above of our calculated debt-to-cash (includes all liabilities except accounts payable) ratio, it stabilized in the past 3 years with an average of 0.2x following a period of a declining trend. However, Apple highlighted it has net cash of $51 bln as of the latest quarter, with total cash and marketable securities valued at $162 bln and total debt (long-term and short-term borrowings only) of $111 bln, thus indicating its massive cash pile.
In addition, management approved another $90 bln stock repurchase program in Q2. The announced stock buyback authorized of $90 bln is in line with last year’s figure in 2022 but is 9.8% higher than its actual stock repurchases of $82.98 bln in 2023.
Given the continued confidence we have in our business now and into the future, today our Board has authorized an additional $90 billion for share repurchases as we maintain our goal of getting to net cash neutral over time. – Luca Maestri, Senior Vice President and Chief Financial Officer.
Outlook
Going forward, we believe Apple’s asset-light manufacturing model and low capital expenditures support its FCFs and we modeled the company’s FCF to remain strong at $107.5 bln and a 5-year forward average FCF margin of 23.78%. We believe this could enable the company to continue its track record of return cashing to shareholders, with a total estimate of $158.5 bln including its net cash of $52 bln (including marketable securities). Thus, we expect the company’s stock buyback track record, which has been at an average % of market cap of 4.3% to continue, boding well for the upside for the company and we accounted for this in our updated valuation below.
Risk: Lengthening Smartphone Product Cycles
We continue to believe a major risk for Apple is the smartphone market which accounts for the majority of its revenues (57% of revenues). In our last coverage, we emphasized the extended lifespan of smartphones, driven by reduced consumer upgrades and prolonged software support. We projected a low growth trajectory for the overall smartphone market, with a forward average of -2.7%. That said, we believe Apple’s solid positioning in the higher-growth premium smartphone market, holding a 75% market share could continue to support its growth. However, stronger competition from key players such as Samsung and Huawei’s reentry into the 5G premium smartphone segment could pose a threat to Apple’s dominance.
Valuation
Khaveen Investments
Based on a discount rate of 11.5% (company’s WACC) and an updated weighted average EV/EBITDA of 23.13x, we derived an upside of -0.33%.
|
DCF Upside |
-0.33% |
|
Stock Buyback Adjustment |
4.3% |
|
Total Upside |
3.99% |
|
Price Target |
$200.20 |
|
Current Price |
$192.53 |
Source: Khaveen Investments.
Additionally, we accounted for the stock buyback in our valuation by adding our discounted cash flow (“DCF”) upside of -0.33% with its 10-year average stock buyback % of the market cap of 4.3% for a total upside of 4%.
Verdict
In conclusion, we have revised our revenue projections, anticipating a slightly lower company growth of 8.2% in 2024 (compared to 12.6% previously). Key factors include diminished projections for the Services segment, particularly impacted by lower App Store spending and slowed Apple Music subscriber growth. We also highlight constrained pricing power in Mac and iPad due to market competition. Our adjusted margin forecasts reflect a more conservative outlook, with gross margins expected to reach 44.6% by 2026 (vs 49.2% previously). The Services segment’s margin is projected to increase to 71.6% (vs 76.23% previously) due to slowed growth. We previously believed the Services segment would significantly influence overall margin growth, but revised projections indicate a more tempered outlook. Additionally, we anticipate stable net margins as increased R&D spending offsets potential profitability from innovative projects. Looking ahead, we believe Apple’s asset-light manufacturing model and low capital expenditures support strong free cash flows, estimated at $107.5 bln in 2024 with a 5-year average FCF margin of 23.78%.
We believe that this positions the company well to maintain its practice of returning cash to shareholders, with an estimated total of $158.5 bln, inclusive of $52 bln in net cash. Overall, we believe Apple’s stock buyback track record could continue, averaging 4.3% of market cap, contributing to potential upside for the company, factored into our updated valuation. With a calculated total upside of only 4% with an updated price target of $200.20 (compared to $194.78 previously), we downgrade Apple Inc. stock as a Hold, as it has reached our price target following its strong 11.8% rise since our previous coverage.
Editor’s Note: This article discusses one or more securities that do not trade on a major U.S. exchange. Please be aware of the risks associated with these stocks.