Fuat Oztas
On any pullback, Apple Inc. (NASDAQ:AAPL) price will shrink with market bites looking for support. On the charts below, we show the horizontal lines of support. We don’t know how many lines of support AAPL will break on the way down. We just wait for the Sell Signal to be reversed and for the bounce to begin. We wait for the technical signals to tell us. It was down almost $4 at $187, after earnings in the after-market.
The support level that holds depends on the value that portfolio managers are willing to start buying again. We know that when price is over-extended that it reverts back to the mean. That could be the 50-day moving average in the case of a popular, buy and hold stock like AAPL, where buyers are willing to ignore valuation and pay a premium for the brand name. For really bad earnings, it could be the 200-day uptrend. We don’t think AAPL is going that low, because of the slight pullback so far.
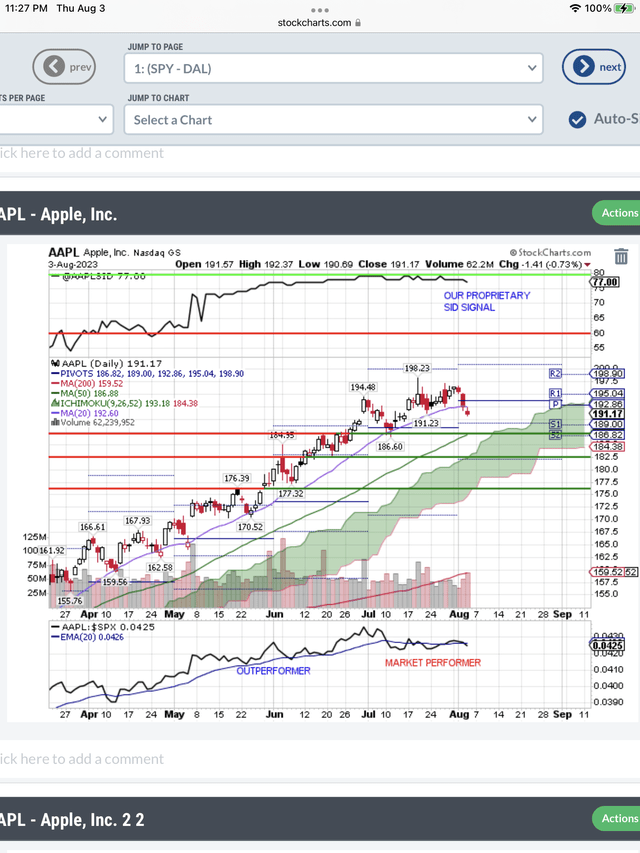
As you can see on the charts below, the 50-day moving average is near $186. There is also price support at that level and you can see the horizontal line we have drawn. So on any pullback in AAPL, we think the first test of support will be at $186.
Then we wait and see how many portfolio managers are willing to buy at that level. If there aren’t many, then price will break below that support level. It will test the next price support level at $182, and that would be bearish break below the 50-day moving average uptrend.
Notice also at the top of this first chart that we have our proprietary Buy, Hold and Sell Signal. You can see it is just below the green line Buy Signal. It is a very strong Hold Signal at 78 where 80 to 100 is a Buy Signal. The market will be very surprised if AAPL drops below $186 to test support at $182, based on our SID signal.
Finally, at the bottom of this first chart is Relative Strength. Portfolio managers want to be in stocks that are outperforming the market. You can see that AAPL has dropped from an outperformer to a market performer. So portfolio managers with large positions in AAPL right now are just Indexing with this holding. That, of course, is better than underperforming the Index, but not as good as outperforming the Index which is their goal.
Here is the first chart for AAPL that shows all of the data we just presented:
Apple Drops Looking For Support At $186 After Earnings Reality Check (StockCharts.com)
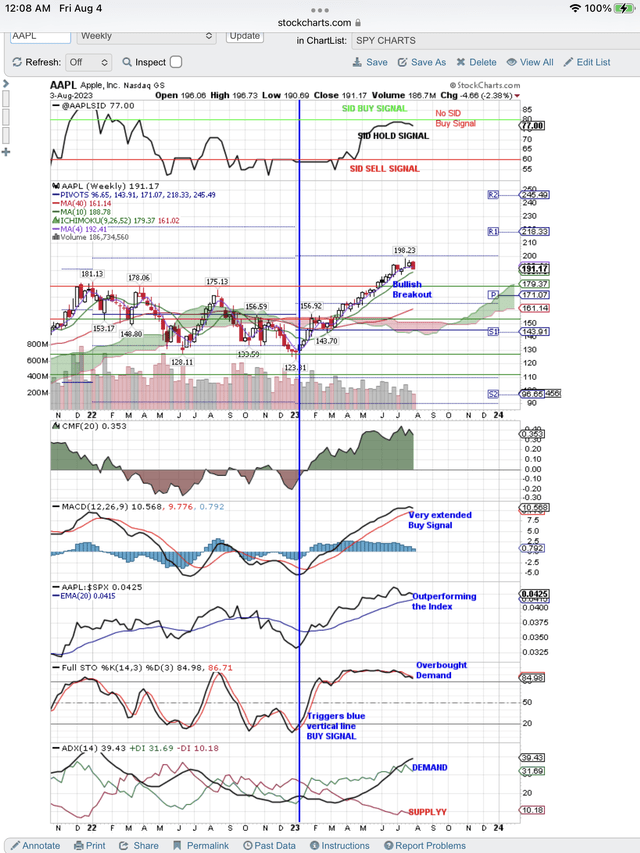
On the second chart shown below, we can see the weekly overview of the long and overextended price move up. It is no surprise that AAPL is having a little pullback, because expectations were too high going into earnings. Also there is a little market pullback that is taking AAPL down with the Index selling. Once again at the top of the chart is our proprietary Buy, Hold and Sell signal. You can see how long AAPL has moved so close to our Buy Signal, but was not able to trigger it.
All the signals on this chart are still positive, but weakening. You can see how overextended price is and the overextended signals that are now dropping. Just look at the MACD bar chart and how enormously long these bars were up compared to previous bars. Now the bars are dropping.
Don’t forget that the weakness on this chart was before earnings. Now with the drop in price, after earnings, all of these signals will continue to show the weakness that we see before earnings.
In conclusion, you can see we have drawn the Apple Inc. price support line at $178-$180. We think this is the target for this post earnings pullback. That will provide a nice 10% gain when price returns to the recent high. Let’s see if that is where the portfolio managers start buying again. They love to buy on weakness.
Here is the weekly chart supporting the above comments:
AAPL Targeting the Horizontal Price Line Support At $178-$180. (StockCharts.com)

