

ozgurdonmaz
In our previous analysis, we determined that Apple Inc’s (NASDAQ:AAPL) success in the Chinese market in 2022 was due to its aggressive pricing strategy, which gave it an edge over Chinese rivals thanks to stronger profit margins. We believe this allowed Apple to cut prices more than competitors, boosting its competitiveness. Additionally, we believe Apple’s dominance in the premium smartphone sector, which proved more resilient than the overall market, supported its growth and market leadership. When comparing Apple to local Chinese smartphone competitors, we identified similar strengths, including a large supply chain in China, government incentives, localization efforts, and minimal impact from trade tensions.
Based on the smartphone market share chart below, the company had maintained its position as the second largest smartphone maker by shipments market share in Q2 2023 at 16%, only behind market leader Samsung. Notwithstanding, Apple dominated the premium smartphone market segment of above $600 according to Counterpoint Research accounting for 3 quarters of the market share, which is 4.7x higher than its market share of the overall market.
IDC, Counterpoint Research, Khaveen Investments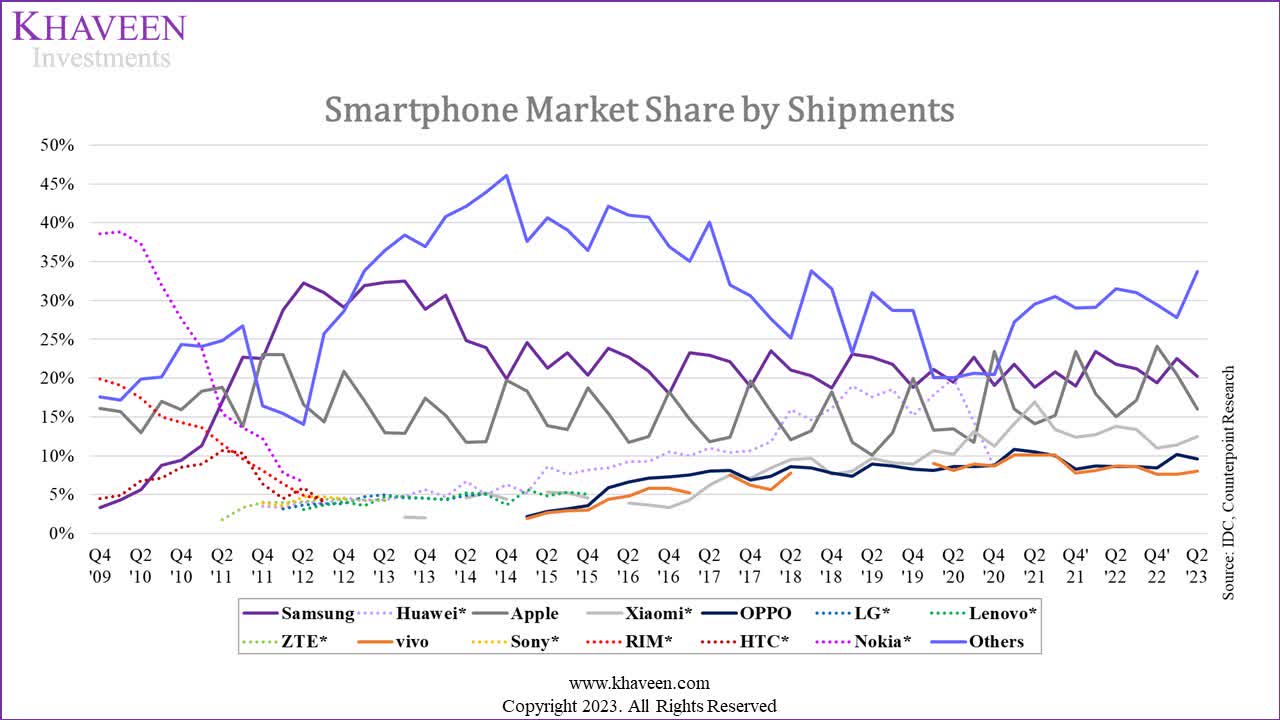
In this analysis, we determined whether the premium smartphone market could continue to drive Apple’s growth. Firstly, we derived a breakdown of the global smartphone market by geographic region and projected the growth based on population and penetration rates. Moreover, we examined the premium smartphone market penetration of each region and forecasted its growth based on income growth. Finally, we examined Apple’s competitive positioning in the premium smartphone market.
Global Smartphone Market Outlook
In this section, we first examined the smartphone market growth in terms of shipments by IDC and derived the breakdown of the smartphone market from and consolidated it based on Apple’s geographic segment breakdown. According to its annual report, its revenue by geographical location consists of the Americas, Europe (encompassing Europe, India, the Middle East, and Africa), Greater China, Japan, and the Rest of Asia Pacific region.
IDC, Khaveen Investments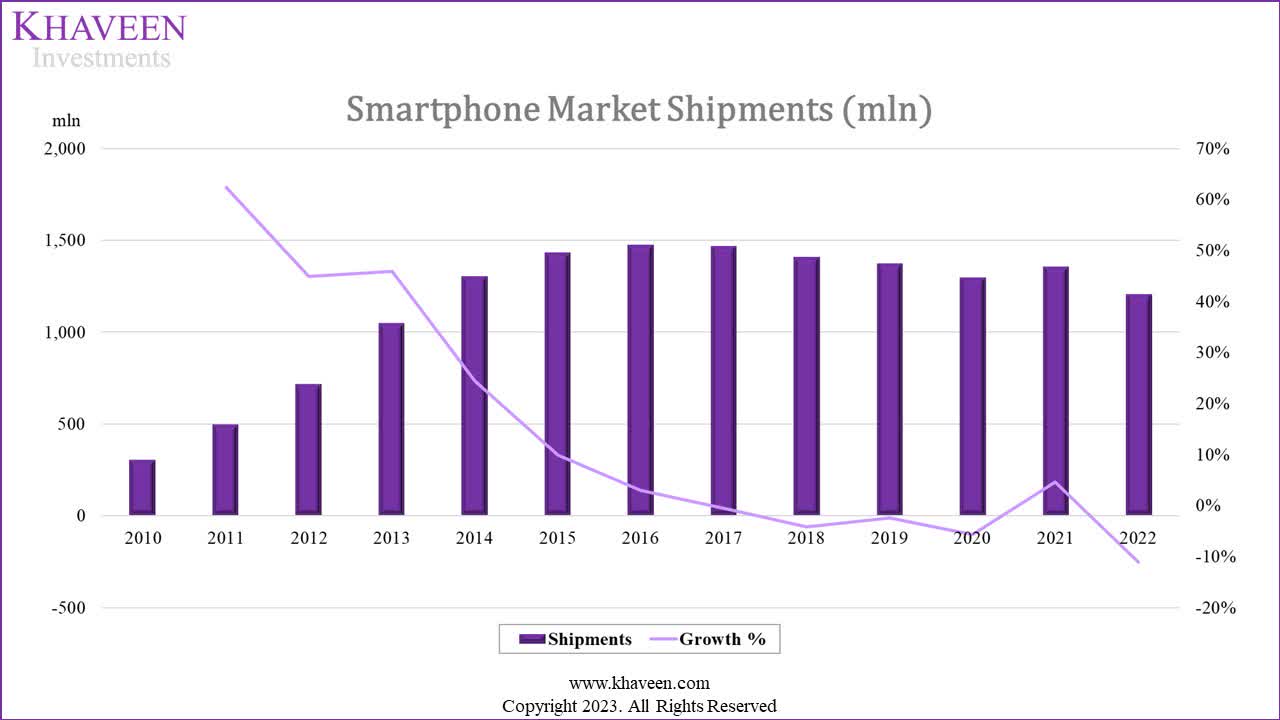
|
Smartphone Shipments (‘mln’) |
2018 |
2019 |
2020 |
2021 |
2022 |
4-year Average |
|
Americas |
269.02 |
258.77 |
241.76 |
260.02 |
235.79 |
|
|
Growth % |
-3.8% |
-6.6% |
7.6% |
-9.3% |
-3.04% |
|
|
Europe (EMEAI) |
499.29 |
515.23 |
501.76 |
535.89 |
476.91 |
|
|
Growth % |
3.2% |
-2.6% |
6.8% |
-11.0% |
-0.91% |
|
|
Greater China |
398.30 |
366.60 |
325.70 |
329.50 |
285.80 |
|
|
Growth % |
-8.0% |
-11.2% |
1.2% |
-13.3% |
-7.80% |
|
|
Japan |
30.12 |
28.05 |
26.00 |
27.37 |
25.55 |
|
|
Growth % |
-6.9% |
-7.3% |
5.3% |
-6.7% |
-3.89% |
|
|
Rest of Asia Pacific |
207.77 |
202.46 |
197.98 |
199.52 |
178.25 |
|
|
Growth % |
-2.6% |
-2.2% |
0.8% |
-10.7% |
-3.66% |
|
|
Total |
1,405 |
1,371 |
1,293 |
1,352 |
1,202 |
|
|
Growth % |
-2.4% |
-5.7% |
4.6% |
-11.1% |
-3.65% |
Source: Gartner, IDC, Khaveen Investments
Based on the chart above, the total global smartphone market in terms of shipments has had an average growth rate of 6.4% in the past 10 years and has been slowing down since 2011. The market peaked in 2016 and declined since then until 2021 with a notable recovery before contracting further in 2022. In the past 5 years, the market grew at an average of -3.7% which is a stark contrast to the prior 5-year average of 16.5%. In our previous analysis, we highlighted the smartphone market facing increasing average product lifespans as consumers were becoming less interested in upgrading to new phones due to a lack of compelling new features. Furthermore, another factor is the increasing length of software updates provided by smartphone makers.
From the table, we consolidated the global smartphone market shipments by Apple’s geographic breakdown based on data from Gartner and IDC in the past 5 years. As seen in the table, the Europe segment is the largest in 2022 accounting for 39.6% of the global smartphone shipments and is followed by Greater China with 23.8% of the total market. Based on the average growth rate in the past 4 years, all regions had negative growth with Greater China having the highest average decline of -7.8% and having consistently underperformed the market growth all of the past years in the table. In contrast, the Europe segment performed the best overall with a flattish average decline of -0.9%.
Projections
Next, we derived our own projections of the smartphone market by shipments based on Apple’s geographic breakdown below. We projected the smartphone market of each respective region based on the population, penetration rate, and replacement rate as we previously did in our previous analysis for the China market. Our smartphone market shipments total projections are broken down into 2 parts which are the new increase in smartphone users and smartphone replacement sales.
To project the increase in smartphone users for each region, we first compiled the total population and projections from Our World in Data. Then, we derived an estimate of the penetration rate for each respective region based on data from Newzoo and Statista in 2018 and 2022 and calculated a weighted average increment in the penetration weight which is front-loaded. For the Europe, Middle East, Africa and India (EMEAI), Americas and Rest of Asia Pacific segments, we based their smartphone penetration rates on selected countries within those regions as a proxy.
Furthermore, for the replacement rate, we calculated the smartphone replacement unit sales based on the difference between the increase in smartphone users by year and the total smartphone shipments for each region. The replacement rate is calculated as a % of the total smartphone shipments for each region. We identified that the replacement rate of all of the main regions had decreased over the past 4 years but increased in 2021 as we believe this is due to the large increase of global 5G smartphone share by 20%. Thus, we excluded 2021 in our 3-year average replacement rate growth which we assumed to forecast its replacement rate.
Finally, we summed up our estimated increase in smartphone users and replacement sales to obtain the total smartphone sales forecast for each region below.
China
|
China Smartphone Market Projections (‘mln’) |
2019 |
2020 |
2021 |
2022 |
2023F |
2024F |
2025F |
2026F |
2027F |
2028F |
|
China Population |
1,410 |
1,412 |
1,413 |
1,412 |
1,412 |
1,411 |
1,409 |
1,407 |
1,404 |
1,401 |
|
Growth % |
0.3% |
0.1% |
0.0% |
-0.1% |
0.0% |
-0.1% |
-0.1% |
-0.2% |
-0.2% |
-0.2% |
|
Penetration Rate |
62.6% |
66.8% |
70.3% |
73.6% |
76.6% |
79.4% |
81.8% |
84.0% |
86.1% |
87.9% |
|
Increase |
4.5% |
4.2% |
3.5% |
3.3% |
3.0% |
2.7% |
2.5% |
2.2% |
2.0% |
1.8% |
|
Increase Growth Factor |
0.94 |
0.83 |
0.95 |
0.91 |
0.91 |
0.91 |
0.91 |
0.91 |
0.91 |
|
|
China Smartphone Users |
882.2 |
943.2 |
993.1 |
1,039 |
1,081 |
1,120 |
1,153 |
1,183 |
1,209 |
1,231 |
|
Growth |
8.1% |
6.9% |
5.3% |
4.7% |
4.0% |
3.5% |
3.0% |
2.6% |
2.2% |
1.9% |
|
Net Increase |
66.2 |
61.0 |
49.9 |
46.3 |
41.8 |
38.4 |
33.4 |
29.6 |
26.1 |
22.8 |
|
Replacement |
300.4 |
264.7 |
279.6 |
239.5 |
235.3 |
230.1 |
223.8 |
216.9 |
209.3 |
201.5 |
|
Replacement Rate |
34.1% |
28.1% |
28.2% |
23.0% |
21.8% |
20.6% |
19.4% |
18.3% |
17.3% |
16.4% |
|
Growth % |
-6.0% |
0.1% |
-5.1% |
-5.5% |
-5.5% |
-5.5% |
-5.5% |
-5.5% |
-5.5% |
|
|
China Smartphone Sales |
366.6 |
325.7 |
329.5 |
285.8 |
277.1 |
268.5 |
257.3 |
246.5 |
235.4 |
224.3 |
|
Growth |
-8.0% |
-11.2% |
1.2% |
-13.3% |
-3.0% |
-3.1% |
-4.2% |
-4.2% |
-4.5% |
-4.7% |
Source: Our World in Data, Gartner, IDC, Statista, Khaveen Investments
For China, this region has the third largest population behind Europe (EMEAI) and the Rest of Asia Pacific. However, the population is projected to decline according to the IMF due to the declining fertility rate in China and government policy that controlled population growth as highlighted in our previous analysis. Its penetration rate is also the second highest among the regions behind Japan with the increase of its penetration rate declining by each year, thus we forecasted the penetration rate to reach 88% by 2027 at a declining rate of increase of 0.91x based on its 3-year average. In total, we forecasted the region’s 5-year forward average growth at -4%.
Americas
|
Americas Smartphone Projections (‘mln’) |
2019 |
2020 |
2021 |
2022 |
2023F |
2024F |
2025F |
2026F |
2027F |
|
Population |
1,018.8 |
1,025.8 |
1,031.4 |
1,037.1 |
1,043.9 |
1,051.0 |
1,058.0 |
1,064.9 |
1,071.6 |
|
Growth % |
0.8% |
0.7% |
0.5% |
0.6% |
0.7% |
0.7% |
0.7% |
0.6% |
0.6% |
|
Penetration Rate |
64.7% |
68.9% |
71.4% |
73.0% |
74.2% |
75.0% |
75.6% |
76.0% |
76.3% |
|
Increase |
5.0% |
4.2% |
2.5% |
1.7% |
1.2% |
0.8% |
0.6% |
0.4% |
0.3% |
|
Increase Growth Factor |
0.83 |
0.60 |
0.67 |
0.70 |
0.70 |
0.70 |
0.70 |
0.70 |
|
|
Smartphone Users |
659.30 |
706.51 |
736.12 |
757.51 |
775 |
788 |
800 |
809 |
817 |
|
Growth |
9.2% |
7.2% |
4.2% |
2.9% |
2.3% |
1.8% |
1.4% |
1.2% |
1.0% |
|
Net Increase |
55.8 |
47.2 |
29.6 |
21.4 |
17.1 |
13.9 |
11.3 |
9.5 |
8.1 |
|
Replacement |
203.0 |
194.6 |
230.4 |
214.4 |
212.4 |
209.4 |
205.8 |
201.7 |
197.4 |
|
Replacement Rate |
30.8% |
27.5% |
31.3% |
28.3% |
27.4% |
26.6% |
25.7% |
24.9% |
24.2% |
|
Growth % |
-3.2% |
3.8% |
-3.0% |
-3.1% |
-3.1% |
-3.1% |
-3.1% |
-3.1% |
|
|
Smartphone Sales |
258.77 |
241.76 |
260.02 |
235.79 |
229.5 |
223.3 |
217.1 |
211.2 |
205.5 |
|
Growth |
-3.8% |
-6.6% |
7.6% |
-9.3% |
-2.7% |
-2.7% |
-2.8% |
-2.7% |
-2.7% |
Source: Our World in Data, Gartner, IDC, Khaveen Investments
For the Americas, this region has the third largest population behind Europe (‘EMEAI’) and China, and its population growth is projected to grow by a 5-year average of 0.7%. Its penetration rate is also the third highest among the regions behind Japan and China with the increase of its penetration rate declining by each year, thus we forecasted the penetration rate to reach 76% by 2027 at a declining rate of increase of 0.7x based on its 3-year average. In total, we forecasted the region’s 5-year forward average growth at -2.7%.
|
Europe (EMEAI) Smartphone Projections (‘mln’) |
2019 |
2020 |
2021 |
2022 |
2023F |
2024F |
2025F |
2026F |
2027F |
|
Population |
3,716 |
3,764 |
3,810 |
3,867 |
3,914 |
3,961 |
4,018 |
4,075 |
4,121 |
|
Growth % |
1.4% |
1.3% |
1.2% |
1.5% |
1.2% |
1.2% |
1.4% |
1.4% |
1.1% |
|
Penetration Rate |
35.6% |
42.0% |
45.8% |
48.4% |
50.2% |
51.4% |
52.3% |
52.9% |
53.4% |
|
Increase |
7.7% |
6.4% |
3.8% |
2.6% |
1.8% |
1.3% |
0.9% |
0.6% |
0.4% |
|
Increase Growth Factor |
0.83 |
0.60 |
0.67 |
0.70 |
0.70 |
0.70 |
0.70 |
0.70 |
|
|
Smartphone Users |
1,324 |
1,581 |
1,747 |
1,871 |
1,964 |
2,037 |
2,102 |
2,156 |
2,199 |
|
Growth |
29.1% |
19.4% |
10.5% |
7.1% |
4.9% |
3.7% |
3.2% |
2.6% |
2.0% |
|
Net Increase |
298.5 |
257.2 |
165.5 |
124.6 |
92.6 |
73.3 |
64.6 |
54.7 |
42.3 |
|
Replacement |
216.7 |
244.6 |
370.4 |
352.3 |
363.7 |
371.1 |
376.6 |
380.1 |
381.2 |
|
Replacement Rate |
16.4% |
15.5% |
21.2% |
18.8% |
18.5% |
18.2% |
17.9% |
17.6% |
17.3% |
|
Growth % |
-0.9% |
5.7% |
-2.4% |
-1.6% |
-1.6% |
-1.6% |
-1.6% |
-1.6% |
|
|
Smartphone Sales |
515.23 |
501.76 |
535.89 |
476.91 |
456.2 |
444.3 |
441.1 |
434.8 |
423.5 |
|
Growth |
3.2% |
-2.6% |
6.8% |
-11.0% |
-4.3% |
-2.6% |
-0.7% |
-1.4% |
-2.6% |
Source: Our World in Data, Gartner, IDC, Khaveen Investments
For EMEAI, this region has the largest population as it includes Europe, Middle East, Africa and India with a population growth projection to grow by a 5-year average of 1.3%. Its penetration rate is the lowest among the regions with the increase of its penetration rate declining by each year, thus we forecasted the penetration rate to reach 53.4% by 2027 at a declining rate of increase of 0.7x based on its 3-year average. In total, we forecasted the region’s 5-year forward average growth at -2.3%.
Japan
|
Japan Smartphone Projections (‘mln’) |
2019 |
2020 |
2021 |
2022 |
2023F |
2024F |
2025F |
2026F |
2027F |
|
Population |
126.6 |
126.1 |
125.5 |
124.3 |
123.8 |
123.2 |
122.5 |
121.9 |
121.2 |
|
Growth % |
-0.2% |
-0.3% |
-0.5% |
-0.9% |
-0.4% |
-0.5% |
-0.5% |
-0.5% |
-0.5% |
|
Penetration Rate |
74.5% |
78.7% |
82.6% |
86.2% |
89.3% |
91.7% |
93.5% |
94.5% |
95.2% |
|
Increase |
5.5% |
4.2% |
3.8% |
3.6% |
3.1% |
2.4% |
1.7% |
1.1% |
0.6% |
|
Increase Growth Factor |
0.76 |
0.91 |
0.94 |
0.87 |
0.78 |
0.70 |
0.63 |
0.57 |
|
|
Smartphone Users |
94 |
99 |
104 |
107 |
111 |
113 |
115 |
115 |
115 |
|
Growth |
7.9% |
5.3% |
4.3% |
3.4% |
3.2% |
2.2% |
1.4% |
0.6% |
0.1% |
|
Net Increase |
6.9 |
5.0 |
4.3 |
3.5 |
3.4 |
2.5 |
1.5 |
0.7 |
0.1 |
|
Replacement |
21.2 |
21.0 |
23.1 |
22.1 |
22.4 |
22.6 |
22.5 |
22.4 |
22.0 |
|
Replacement Rate |
22.5% |
21.1% |
22.3% |
20.6% |
20.3% |
20.0% |
19.7% |
19.4% |
19.1% |
|
Growth % |
-1.3% |
1.1% |
-1.7% |
-1.5% |
-1.5% |
-1.5% |
-1.5% |
-1.5% |
|
|
Smartphone Sales |
28.05 |
26.00 |
27.37 |
25.55 |
25.8 |
25.1 |
24.1 |
23.1 |
22.2 |
|
Growth |
-6.9% |
-7.3% |
5.3% |
-6.7% |
1.0% |
-2.9% |
-3.9% |
-4.2% |
-4.0% |
Source: Statistics Bureau of Japan, Our World in Data, Gartner, IDC, Khaveen Investments
For Japan, this region has the smallest population with a population growth projection to grow by a 5-year average of -0.5%. Its penetration rate is the highest among the regions with the increase of its penetration rate declining by each year, thus we forecasted the penetration rate to reach 98% by 2027 at a declining rate of increase of 0.87x based on its 3-year average. Moreover, its replacement rate had also decreased over the past 4 years but increased in 2021 as we believe this is due to the large increase of 5G smartphone share by 20%. Thus, we excluded 2021 in our 3-year average replacement rate growth which we assumed to forecast its replacement rate. In total, we forecasted the region’s 5-year forward average growth at -1%.
Rest of Asia Pacific
|
Rest of Asia Smartphone Projections (‘mln’) |
2019 |
2020 |
2021 |
2022 |
2023F |
2024F |
2025F |
2026F |
2027F |
|
Population |
1,498 |
1,510 |
1,523 |
1,537 |
1,550 |
1,564 |
1,579 |
1,605 |
1,612 |
|
Growth % |
1.1% |
0.8% |
0.9% |
1.0% |
0.8% |
0.9% |
1.0% |
1.6% |
0.4% |
|
Penetration Rate |
35.9% |
43.8% |
48.6% |
51.8% |
54.0% |
55.5% |
56.6% |
57.4% |
57.9% |
|
Increase |
9.5% |
7.9% |
4.8% |
3.2% |
2.2% |
1.6% |
1.1% |
0.8% |
0.5% |
|
Increase Growth Factor |
0.83 |
0.60 |
0.67 |
0.70 |
0.70 |
0.70 |
0.70 |
0.70 |
|
|
Smartphone Users |
538 |
661 |
740 |
796 |
837 |
869 |
894 |
921 |
933 |
|
Growth |
37.7% |
23.0% |
11.8% |
7.5% |
5.2% |
3.8% |
2.9% |
3.0% |
1.3% |
|
Net Increase |
147.2 |
123.9 |
78.2 |
55.8 |
41.1 |
32.1 |
25.6 |
26.8 |
12.3 |
|
Replacement |
55.3 |
74.1 |
121.3 |
122.4 |
128.7 |
133.6 |
137.4 |
141.5 |
143.3 |
|
Replacement Rate |
10.3% |
11.2% |
16.4% |
15.4% |
15.4% |
15.4% |
15.4% |
15.4% |
15.4% |
|
Growth % |
0.9% |
5.2% |
-1.0% |
0.0% |
0.0% |
0.0% |
0.0% |
0.0% |
|
|
Smartphone Sales |
202.46 |
197.98 |
199.52 |
178.25 |
169.8 |
165.6 |
163.0 |
168.3 |
155.6 |
|
Growth |
-2.6% |
-2.2% |
0.8% |
-10.7% |
-4.8% |
-2.4% |
-1.6% |
3.3% |
-7.5% |
Source: Our World in Data, Gartner, IDC, Statista, Khaveen Investments
For the Rest of Asia Pacific, this region has the second highest population with the second highest population growth projection at a 5-year average of 1%. Its penetration rate is the second lowest among the regions with the increase of its penetration rate declining by each year, thus we forecasted the penetration rate to reach 58% by 2027 at a declining rate of increase of 0.7x based on its 3-year average. In total, we forecasted the region’s 5-year forward average growth at -2.6%.
Summary
|
Smartphone Market Projections (‘mln’) |
2019 |
2020 |
2021 |
2022 |
2023F |
2024F |
2025F |
2026F |
2027F |
Average |
|
Americas |
258.77 |
241.76 |
260.02 |
235.79 |
229.50 |
223.30 |
217.11 |
211.19 |
205.52 |
|
|
Growth % |
-3.8% |
-6.6% |
7.6% |
-9.3% |
-2.7% |
-2.7% |
-2.8% |
-2.7% |
-2.7% |
-2.7% |
|
Europe (EMEAI) |
515.23 |
501.76 |
535.89 |
476.91 |
456.24 |
444.35 |
441.14 |
434.77 |
423.50 |
|
|
Growth % |
3.2% |
-2.6% |
6.8% |
-11.0% |
-4.3% |
-2.6% |
-0.7% |
-1.4% |
-2.6% |
-2.3% |
|
China |
366.60 |
325.70 |
329.50 |
285.80 |
277.11 |
268.49 |
257.26 |
246.45 |
235.41 |
|
|
Growth % |
-8.0% |
-11.2% |
1.2% |
-13.3% |
-3.0% |
-3.1% |
-4.2% |
-4.2% |
-4.5% |
-3.8% |
|
Japan |
28.05 |
26.00 |
27.37 |
25.55 |
25.80 |
25.06 |
24.09 |
23.08 |
22.17 |
|
|
Growth % |
-6.9% |
-7.3% |
5.3% |
-6.7% |
1.0% |
-2.9% |
-3.9% |
-4.2% |
-4.0% |
-2.8% |
|
Other Asia Pacific |
202.46 |
197.98 |
199.52 |
178.25 |
169.78 |
165.63 |
162.98 |
168.32 |
155.64 |
|
|
Growth % |
-2.6% |
-2.2% |
0.8% |
-10.7% |
-4.8% |
-2.4% |
-1.6% |
3.3% |
-7.5% |
-2.6% |
|
Total |
1,371 |
1,293 |
1,353 |
1,202 |
1,158 |
1,127 |
1,102 |
1,084 |
1,042 |
|
|
Growth % |
-2.4% |
-5.7% |
4.6% |
-11.1% |
-3.6% |
-2.7% |
-2.2% |
-1.7% |
-3.8% |
-2.8% |
Source: Our World in Data, Gartner, IDC, Khaveen Investments
In summary, the smartphone market is a market which had slowing growth over the past 10 years which indicates it is a maturing market and is attributed to factors such as increasing average life of smartphones due to reasons such as lack of consumer appeal to new upgrades and longer software update support for old phones.
Based on our projections, the China region has the lowest average growth rate (-3.8%). This is because China’s replacement rate had decreased the highest at an average of -5.5% (excluding 2021). According to China Mobile Terminal Laboratory, Chinese smartphone makers such as Honor, Oppo, Huawei and Vivo’s “upgrade cycle” is lengthier (25.95 months) compared to other Android brands such as Samsung (OTCPK:SSNLF) (24.5 months). Thus, we believe this region has the least growth potential among the other regions. In comparison, EMEAI has the highest average growth rate but is still negative at -2.3% as it is supported by having the highest population growth projection of an average of 1.3%
In total, we forecast the total market growth to decline by an average of -2.8%. This is mainly due to the slowing increase in penetration rate from 57.3% globally in 2022 to our forecasted rate of 63.3% by 2027. Also, we projected the average replacement rate globally to decline from 20.8% to 18% by 2027.
Global Premium Market Outlook
Based on the table below, we calculated the premium smartphone market segment shipments (above $600) in the past 7 years based on Counterpoint Research.
|
Global Premium Smartphone Shipments |
2016 |
2017 |
2018 |
2019 |
2020 |
2021 |
2022 |
Average |
|
Premium Share of Total |
7% |
8% |
13% |
15% |
15% |
19% |
21% |
|
|
Non-Premium Share |
93% |
92% |
87% |
85% |
85% |
81% |
79% |
|
|
Global Total Smartphone Market Shipments (‘mln’) |
1,472 |
1,465 |
1,405 |
1,371 |
1,293 |
1,352 |
1,202 |
|
|
Premium Shipments (‘mln’) |
103.1 |
117.2 |
182.6 |
205.7 |
194.0 |
256.9 |
252.5 |
|
|
Growth % |
13.7% |
55.8% |
12.6% |
-5.7% |
32.5% |
-1.7% |
17.9% |
|
|
Non-Premium Shipments |
1,369 |
1,348 |
1,222 |
1,165 |
1,099 |
1,095 |
950 |
|
|
Growth % |
-1.6% |
-9.3% |
-4.6% |
-5.7% |
-0.4% |
-13.3% |
-5.8% |
Source: Counterpoint Research, IDC, Khaveen Investments
As seen, the premium segment growth had outperformed the non-premium segment with an average growth of 17.9% compared to -5.8% for the non-premium segment. Furthermore, we compiled the GDP per capita growth for each of the 5 regions in the table below.
|
GDP Per Capita Growth by Region |
2019 |
2020 |
2021 |
2022 |
2023 |
2024 |
2025 |
2026 |
2027 |
2028 |
Average |
Forward Average |
|
Americas |
-0.4% |
-11.2% |
14.0% |
12.1% |
6.9% |
4.8% |
3.4% |
4.7% |
3.5% |
3.6% |
3.6% |
4.5% |
|
Europe (EMEAI) |
0.1% |
-7.8% |
14.9% |
8.2% |
2.4% |
4.0% |
4.8% |
4.6% |
4.5% |
4.6% |
3.9% |
4.2% |
|
China |
3.3% |
3.5% |
19.4% |
1.9% |
7.1% |
7.9% |
7.4% |
7.4% |
7.2% |
7.1% |
7.0% |
7.4% |
|
Japan |
1.8% |
-1.1% |
-0.6% |
-15.2% |
4.6% |
3.1% |
5.0% |
4.6% |
3.7% |
5.8% |
-3.8% |
4.5% |
|
Other Asia Pacific |
1.7% |
-0.4% |
14.2% |
-0.1% |
5.6% |
6.0% |
6.1% |
6.1% |
5.9% |
6.1% |
3.8% |
6.0% |
Source: IMF, Khaveen Investments
China had the highest average GDP per capita growth with an average of 7% in the past 3 years whereas Japan is the only region with a negative average growth. Based on the IMF, China is projected to continue having the highest growth with an average of 7.4% followed by the Rest of Asia Pacific. In our previous analysis, we highlighted its fast economic growth due to increasing productivity and large capital investments.
To project the premium smartphone market sales by region, we first estimated the share of premium smartphone sales by region. To do this, we first compiled the market share of the premium smartphone makers in 2022 and their market share of the total smartphone shipments in each of the 5 regions. We then multiplied each smartphone maker’s market share by region with their premium share and calculated the total share of premium smartphones for each region.
Counterpoint Research, Khaveen Investments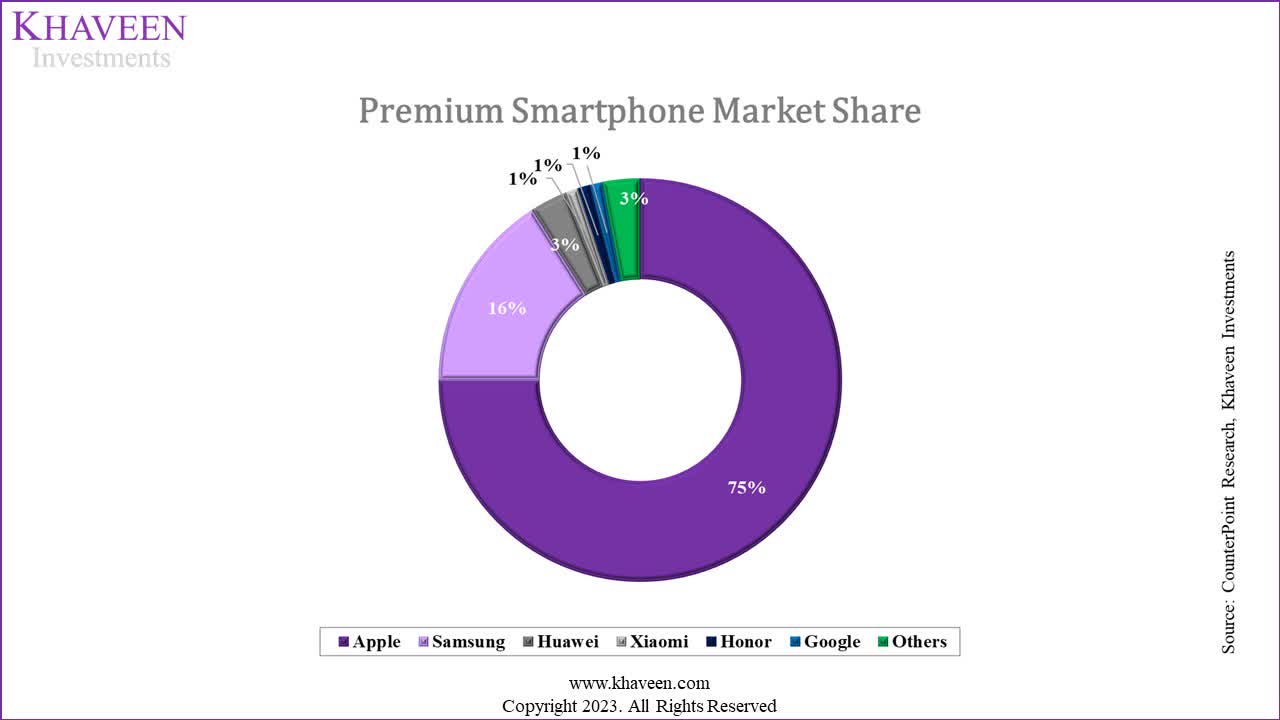
In 2022, the premium smartphone market was predominantly led by Apple, which held a commanding 75% market share, showcasing its strong position and popularity in this segment. Samsung followed as the second-largest player with a 16% share.
|
Market Share of Smartphone Makers |
Americas |
Europe (EMEAI) |
China |
Japan |
Other Asia Pacific |
|
Apple |
27.00% |
14% |
22% |
49.00% |
16.13% |
|
Samsung |
32.50% |
29% |
9.10% |
24.51% |
|
|
Huawei |
0% |
5.62% |
|||
|
Xiaomi (OTCPK:XIACF) |
6.5% |
17% |
12% |
17.51% |
|
|
Honor |
0% |
15% |
|||
|
Google (GOOG) |
1.50% |
||||
|
Others |
32.5% |
40.5% |
51.0% |
41.9% |
36.2% |
Source: Counterpoint Research, IDC, Khaveen Investments
Based on the table above of the smartphone market share, among the regions, Apple’s market share is the highest in Japan and was the market leader there, followed by the Americas.
|
Premium Market Share |
Americas |
Europe (EMEAI) |
China |
Japan |
Other Asia Pacific |
|
Total Share of Premium |
26.5% |
16.5% |
18.3% |
39.5% |
17.4% |
|
Total Share of Non-Premium |
73.5% |
83.5% |
81.7% |
60.5% |
82.6% |
Source: Counterpoint Research, IDC, Khaveen Investments
In the table above, we calculated the total share of premium smartphones by region by multiplying the market share of the smartphone markets of each region with their market share of the total global premium smartphone market. As seen, the region with the highest share is Japan at almost 40% followed by the Americas at 26.5%.
|
Premium Smartphone Market Share |
Americas |
Europe (EMEAI) |
China |
Japan |
Other Asia Pacific |
|
Apple |
76.4% |
63.8% |
90.2% |
93.1% |
69.3% |
|
Samsung |
19.6% |
27.8% |
N/A |
3.7% |
22.5% |
|
Huawei |
N/A |
N/A |
N/A |
N/A |
1.0% |
|
Xiaomi |
0.2% |
1.0% |
0.7% |
N/A |
1.0% |
|
Honor |
N/A |
N/A |
0.8% |
N/A |
N/A |
|
|
0.1% |
N/A |
N/A |
N/A |
N/A |
|
Others |
3.7% |
7.3% |
8.4% |
3.2% |
6.2% |
Source: Counterpoint Research, IDC, Khaveen Investments
Furthermore, the table above shows our market share estimates of each of the top premium smartphone makers in the main geographic regions. From the table, Apple has the highest share in all markets especially Japan followed by China at over 90% in both regions. On the other hand, Samsung trails behind as the second largest in all markets. In the Americas region, Apple’s market share is buoyed by its high market share in the US which was 48.7% in 2022 but has a low share in the South American market (4%).
Projections
Based on the GDP per capita growth projections by region from the IMF, we forecast the premium smartphone market for each region. We did this by multiplying our smartphone market forecast growth rate for each region with their respective GDP per capita projected growth.
|
Premium Smartphone Market Projections |
2022 |
2023F |
2024F |
2025F |
2026F |
2027F |
Average |
|
Americas |
62.50 |
65.02 |
66.30 |
66.67 |
67.87 |
68.39 |
|
|
Growth % |
4.0% |
2.0% |
0.6% |
1.8% |
0.8% |
1.8% |
|
|
Europe (EMEAI) |
78.80 |
77.19 |
78.21 |
81.36 |
83.89 |
85.41 |
|
|
Growth % |
-2.0% |
1.3% |
4.0% |
3.1% |
1.8% |
1.6% |
|
|
China |
52.30 |
54.30 |
56.75 |
58.42 |
60.13 |
61.58 |
|
|
Growth % |
3.8% |
4.5% |
2.9% |
2.9% |
2.4% |
3.3% |
|
|
Japan |
10.08 |
10.65 |
10.67 |
10.77 |
10.80 |
10.75 |
|
|
Growth % |
5.7% |
0.2% |
1.0% |
0.2% |
-0.4% |
1.3% |
|
|
Other Asia Pacific |
31.10 |
31.30 |
32.38 |
33.82 |
37.05 |
36.27 |
|
|
Growth % |
0.6% |
3.5% |
4.4% |
9.5% |
-2.1% |
3.2% |
|
|
Total |
234.8 |
238.5 |
244.3 |
251.1 |
259.7 |
262.4 |
|
|
Growth % |
1.6% |
2.5% |
2.8% |
3.5% |
1.0% |
2.3% |
Source: Counterpoint Research, IDC, Khaveen Investments
In total, based on our projections in the table above, all regions have positive growth which is in contrast with our total smartphone market projections. The segment with the highest average among the listed regions is China with an average growth rate of 3.3% despite our projections for its total smartphone sales being the lowest, due to its GDP per capita growth which is the highest among the regions at 7.4%. However, Apple already dominates the Chinese premium market. In comparison, we believe the EMEAI segment which is the largest market by shipments could provide Apple with growth opportunities not just limited to the market growth of 1.6% but also possibly for it to gain market share in the region as it has a low market share in Middle East, Africa and India. Furthermore, the Rest of Asia Pacific has the second highest average growth but is fourth in terms of market share, though we believe Apple could focus on the segment as well as its market share is the second lowest in this region. Based on its previous earnings briefing, the company highlighted that it had record sales in both EMEAI and the Rest of Asia Pacific regions including India as well as “Middle East and Africa, Indonesia, the Philippines, Italy, the Netherlands and the U.K”.
Competition in Premium Market
In this section, we examine whether Apple could maintain its market share in the premium smartphone market. We did this by comparing the premium smartphone makers in terms of 3 criteria which are branding, features and product breadth.
|
Premium Market Share |
2021 |
2022 |
|
Apple |
71% |
75% |
|
Samsung |
17% |
16% |
|
Huawei |
5% |
3% |
|
Xiaomi |
2% |
1% |
|
Honor |
1% |
1% |
|
|
1% |
1% |
|
Others |
3% |
3% |
Source: Counterpoint Research, Khaveen Investments
In 2021, Apple dominated the premium smartphone market with a commanding 71% market share, followed distantly by Samsung at 17%, while other competitors like Huawei, Xiaomi, Honor, and Google held smaller shares ranging from 5% to 1%. However, in 2022, Apple further strengthened its position, increasing its market share to 75%, and solidifying its leadership in the premium segment. Meanwhile, Samsung saw a slight decline to 16%, while Huawei’s share dropped to 3%, and Xiaomi reduced to 1%. Honor, Google, and other players maintained their respective 1% to 3% market shares.
Branding
For our Branding criteria, we compared the top premium smartphone brands in terms of customer satisfaction/(NPS Score), popularity (Google Trends) and company influence to drive positive financial impact (Interbrand ranking). For NPS Score, we referred to data from Comparably which derived the scores for each brand based on public response to gauge customer satisfaction. Moreover, we referred to Google Trends as the dominant most popular search engine globally. Finally, we referred to Interbrand which ranked these brands based on a comprehensive set of factors such as financial performance, role of brand in purchase decisions and brand ability to create loyalty according to its website.
|
Company |
NPS Score |
Google Trends |
Interbrand Ranking |
|
Apple |
50 |
68 |
1 |
|
Samsung |
36 |
85 |
5 |
|
Huawei |
38 |
10 |
86 |
|
Xiaomi |
43 |
17 |
84 |
|
Honor |
38 |
6 |
>100 |
|
|
45 |
3 |
4 |
Source: Counterpoint Research, Khaveen Investments
For branding, we compared the companies in terms of NPS score, Google Trend score and Interbrand rankings. Apple tops the NPS chart with a score of 50, signifying high customer loyalty and satisfaction, while also holding the first place in Interbrand’s ranking. Samsung, with a lower NPS of 36, ranks fifth in Interbrand’s list but shows strong popularity on Google Trends. Huawei, Xiaomi, and Honor have NPS scores ranging from 38 to 43, with Huawei having the highest Interbrand ranking among them at 86.
Features
For our Features criteria, we compared the top premium smartphone makers based on a set of metric scores derived from DXOMark which conducted various tests on each company’s premium smartphone model based on Camera, Selfie, Audio, Display and Battery metrics.
|
Company |
Camera and Selfie |
Audio |
Display |
Battery |
Average |
|
Apple |
142 |
142 |
144 |
123 |
136.6 |
|
Samsung |
134 |
136 |
149 |
122 |
132.7 |
|
Huawei |
150 |
143 |
144 |
121 |
139.1 |
|
Xiaomi |
132 |
108 |
132 |
128 |
126.9 |
|
Honor |
136 |
138 |
145 |
125 |
133.9 |
|
|
141 |
135 |
148.5 |
95 |
127.3 |
Source: DXOMark, Khaveen Investments
For the features comparison, we based our data on DXOMark which scores each of the company’s smartphone models based on Camera and Selfie, Audio, Display and Battery. We also compiled the number of smartphone products each company has in the premium segment in the past 1 year. Based on the table, Huawei is the top performer with the highest average score of 139.1, particularly excelling in the Camera and Audio categories. Apple trails behind Huawei with higher scores in the Battery category but lower scores in Camera, Audio and Display.
Performance
For our Performance criteria, we compared the top premium smartphone makers based on their average AnTuTu benchmark score which encompasses the performance evaluation of each smartphone’s CPU, GPU, memory and user experience.
|
Company |
Average Performance Score |
|
Apple |
1,398,692 |
|
Samsung |
1,511,635 |
|
Huawei |
1,166,084 |
|
Xiaomi |
1,482,294 |
|
Honor |
1,110,866 |
|
|
815,169 |
Source: AnTuTu, Khaveen Investments
Based on the table, Apple trails behind Samsung and Xiaomi with the highest average AnTuTu benchmark scores but is ahead of competitors such as Huawei, Honor and Google. This indicates that Samsung’s premium smartphones offer superior performance capabilities compared to competitors.
Product Breadth
Finally, our last factor for comparison is Product Breadth, which we based on the number of smartphone models the company had in the past 1 year based on data from DXOMark.
|
Company |
Number of Smartphones |
|
Apple |
4 |
|
Samsung |
5 |
|
Huawei |
2 |
|
Xiaomi |
4 |
|
Honor |
2 |
|
|
2 |
Source: DXOMark, Khaveen Investments
Based on the table, Samsung has the largest product breadth as it has a greater number of premium models which includes its flagship Galaxy S series as well as foldable phones. This is followed by Apple and Xiaomi which are tied with 4 models each. Huawei, Honor and Google have the smallest product breadth with only 2 models each. Thus, this highlights a slight product breadth advantage for Samsung offering consumers more choices.
Overall
|
Ranking |
Branding |
Features |
Performance |
Product Breadth |
Average |
Competitive Factor Score |
|
Apple |
1 |
2 |
3 |
2 |
2.00 |
1.30 |
|
Samsung |
3 |
4 |
1 |
1 |
2.25 |
1.25 |
|
Huawei |
5 |
1 |
4 |
4 |
3.50 |
1.00 |
|
Xiaomi |
4 |
6 |
2 |
2 |
3.50 |
1.00 |
|
Honor |
6 |
3 |
5 |
4 |
4.50 |
0.80 |
|
|
2 |
5 |
6 |
4 |
4.25 |
0.85 |
Competitive Factor Score = [(6-Average Ranking)/6] +0.5
Source: Khaveen Investments
Based on the data, we ranked each of the premium smartphone makers across four metric areas which are Branding, Features, Performance and Product Breadth, with an average score provided for each company. Apple has the top position with an overall average ranking of 2.00. Samsung follows closely with an average ranking of 2.25, excelling in Performance and Product Breadth. Huawei, Xiaomi, Google and Honor are ranked consecutively. Overall, we believe Apple is the top premium smartphone maker as a whole with a top ranking in Branding and is only one position behind in terms of Features and Product Breadth and two positions behind in Performance. We estimated a factor score based on its average which we multiplied with our premium smartphone market projections to forecast its growth for the iPhone segment. A higher score than 1 implies a growth above the market.
Risk: Huawei Competition
We believe one of the risks to Apple in the premium segment is Huawei. According to TechInsights, Huawei’s new Mate 60 Pro features a 7nm chip (~$970) which provides it with 5G capabilities despite US sanctions. Furthermore, China had reportedly banned iPhones for workers within the government premises which could affect Apple’s competitiveness. In 2020, Huawei had a market share of 17% of the smartphone market above $400 but has decreased significantly in 2021 to 6%. In 2022, it has only a 3% market share of the $600 premium smartphone market.
In our previous analysis, we highlighted that the embargo against Huawei benefitted Chinese smartphone makers in China, especially Honor. However, we believe Huawei’s resurrection with premium 5G phones could affect Apple more greatly as Honor only had a minimal share of 1% compared to Apple whose market share increased to 75% in 2022. Overall, Huawei lost market share after the US government restricted its access to 5G. Now that it has reportedly achieved 5G capabilities, we believe this could pose a threat to Apple and other competitors in the premium smartphone market.
Valuation
|
Apple Revenue Forecast ($ mln) |
2022 |
2023F |
2024F |
2025F |
2026F |
|
iPhone |
205.5 |
209.04 |
217.59 |
226.50 |
235.77 |
|
Growth % |
7.0% |
1.7% |
4.1% |
4.1% |
4.1% |
|
Mac |
40.2 |
28.99 |
39.79 |
41.79 |
43.89 |
|
Growth % |
14.2% |
-27.8% |
37.3% |
5.0% |
5.0% |
|
iPad |
29.3 |
29.14 |
33.72 |
34.46 |
35.21 |
|
Growth % |
-8.1% |
-0.5% |
15.7% |
2.2% |
2.2% |
|
Wearables, home and accessories |
41.2 |
40.70 |
46.23 |
51.14 |
55.03 |
|
Growth % |
7.4% |
-1.3% |
13.6% |
10.6% |
7.6% |
|
Services |
78.1 |
83.85 |
102.99 |
126.39 |
155.51 |
|
Growth % |
14.2% |
7.3% |
22.8% |
22.7% |
23.0% |
|
Total |
394.3 |
391.7 |
440.3 |
480.3 |
525.4 |
|
Total Growth % |
7.8% |
-0.7% |
12.4% |
9.1% |
9.4% |
Source: Khaveen Investments
We updated our valuation from our previous analysis with our new projections as seen in the table above. For 2023, we prorated its revenues based on its Q1 to Q3 segment results to forecast its total revenues. Beyond 2023, we updated our growth forecasts for its iPhone segment. As discussed in the third point, we forecasted its shipment growth adjusted by our factor score at an average of 2.8%. Furthermore, we applied our forecasted ARPU growth from the previous analysis to forecast its total iPhone growth of 4.1%.
Khaveen Investments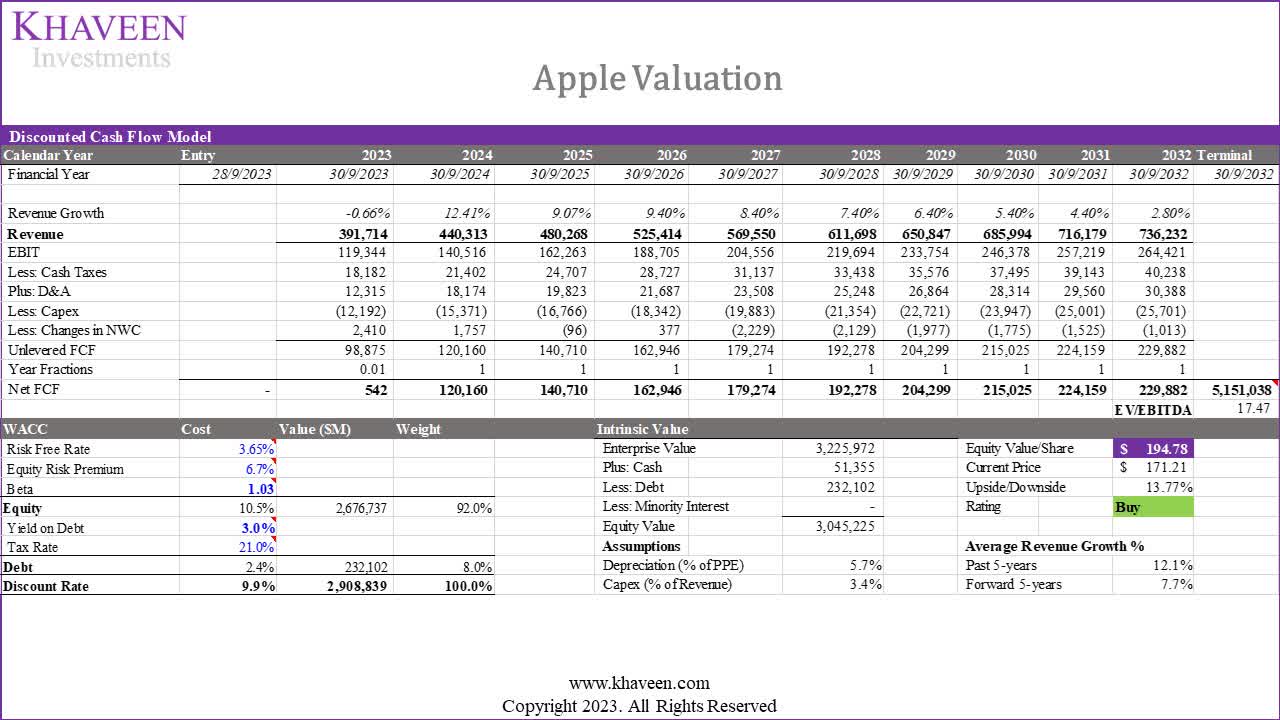
Based on our updated DCF model with a discount rate of 9.9% (company’s WACC), we obtained an upside of 13.77% with the terminal value based on a weighted average EV/EBITDA of 17.47x.
|
EV/EBITDA |
Revenue ($ bln) |
Weight |
Weighted Average |
|
Product |
316.2 |
80.2% |
14.38x |
|
Service |
78.1 |
19.8% |
29.99x |
|
Total |
394.3 |
100.0% |
17.47x |
Source: Seeking Alpha, Khaveen Investments
Verdict
In summary, we believe that the smartphone market has shown signs of slowing growth over the past decade, indicative of a maturing industry. This deceleration can be attributed to several factors, including the lengthening average lifespan of smartphones due to reduced consumer enthusiasm for frequent upgrades and the extended software support provided for older devices. Our forecast indicates an anticipated decline in the total market growth, averaging at -2.8%. This projection primarily stems from the sluggish rise in penetration rates, which are expected to reach 63.4% globally by 2027, as well as a reduced global replacement rate, projected to decline from 20.8% to 18% by the same year. Despite the overall market contraction, our data suggests that all regions are likely to experience positive growth. We anticipate China, in particular with an average growth rate of 3.3% due to its strong GDP per capita growth forecast compared to other regions.
Furthermore, we have evaluated premium smartphone makers based on key metrics including Branding, Features, Performance and Product Breadth. In our assessment, Apple emerges as the top performer, boasting an impressive overall average score of 2. This places it firmly in the lead, supported by its exceptional Branding and Product Breadth. When considering these rankings, we believe that Apple currently holds the dominant position among premium smartphone makers, ranking first in Branding and trailing only slightly in Features and Product Breadth. This evaluation is further utilized to estimate a factor score for Apple, which we then multiplied by our premium smartphone market projections to forecast its growth within the iPhone segment. Overall, we maintain our Buy rating but with a lower price target of $194.78 due to a lower 5-year forecast of 7.7% compared to 9.9% previously as the company faces short-term headwinds in 2023 before our expectations of a growth recovery in 2024.
Editor’s Note: This article discusses one or more securities that do not trade on a major U.S. exchange. Please be aware of the risks associated with these stocks.