

Wirestock
Thesis
In my previous article concerning Apple Inc. (NASDAQ:AAPL), I discussed why even if China were to be entirely removed from Apple’s revenue equation, the stock would, at most, experience a modest downside of approximately 4.2%. In this article, I will elucidate why Apple has the potential to yield respectable returns, estimated at around 12% according to my models. Although this figure may seem relatively low, the current upside potential for Apple is approximately 20%.
Furthermore, Apple’s products do not occupy a significant share of the market, providing ample room for further expansion. As an innovative company boasting a robust financial position, I believe Apple represents a valuable investment. In light of these considerations, I am reiterating my “buy” recommendation for Apple.
Overview
Since the release of the iPhone 15, demand for this product has remained robust, surpassing that of the iPhone 14 in the September month, as reported by Apple.
On November 2, Apple unveiled its Q4 2023 earnings. Notably, the iPhone was the sole product exhibiting growth, in contrast to MAC sales which declined by 34% on a YoY basis, and iPad sales, which also saw a YoY decrease of 10%. For a more detailed breakdown of Apple’s financial figures, please refer to the “Financials” section of this article. In addition, Apple’s services segment continued to perform well, showing a growth rate of 16% on a YoY basis.
Now, let’s delve into the growth prospects for each of Apple’s segments. Firstly, we have the consumer electronics market, which is anticipated to exhibit a growth rate of 2.27%, as per Statista’s projections. However, an alternate perspective from Yahoo Finance suggests a potentially more robust CAGR of 5.2% spanning the years 2023 to 2033, in contrast to Statista’s forecast, which encompasses the period from 2023 to 2028.
Next, we turn our attention to Apple’s services, a substantial segment that can be further categorized into apps, repairs, and banking. The apps segment is predominantly underpinned by App Store revenue and is expected to experience growth ranging from 8.58% to 14.4%. Meanwhile, the consumer electronics repair market is forecasted to grow at a rate spanning from 3.6% to 7.7%. In the realm of banking operations, we look to the “fintech” market, where projections indicate a potential CAGR range of 9.9% to 20%, with the upper end of this range being the highest estimate sourced from Allied Market Research.
Lastly, we consider the consumer electronics accessories sector, with an estimate of a CAGR between 5.56% and 8.3%. It’s important to note that these estimates have been collated from various sources.
Financials
In Q3 2023, Apple reported a TTM revenue of $383.93 billion. However, in the latest earnings report for Q4 2023, Apple’s TTM revenue dipped slightly to $383.28 billion, indicating a marginal reduction of around 0.16%, which may be considered relatively insignificant.
Author’s Calculations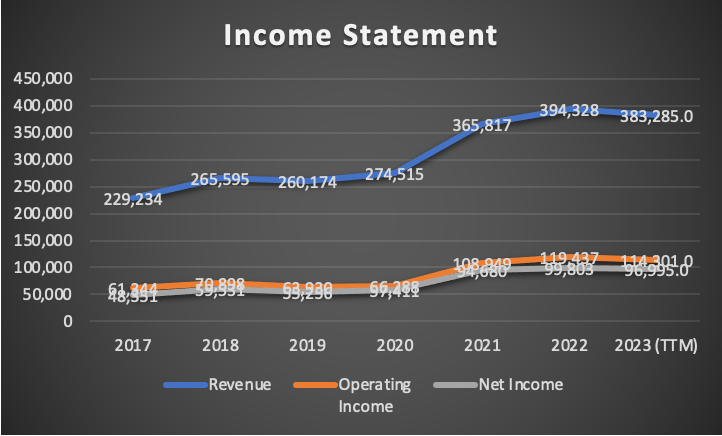
On the bright side, Apple’s margins improved notably from Q3 to Q4 2023. In Q3 2023, the TTM operating margin stood at 29.23%, and the net income margin was 24.68%. As shown in the table below, both of these figures increased in Q4 2023, reaching 29.82% and 25.31%, respectively.
Author’s Calculations
Turning our attention to the balance sheet, Apple continued its trend of reducing long-term debt, which decreased from $98.07 billion to $95.28 billion. In contrast, short-term debt experienced an increase, rising from $11.20 billion to $28.6 billion.
Author’s Calculations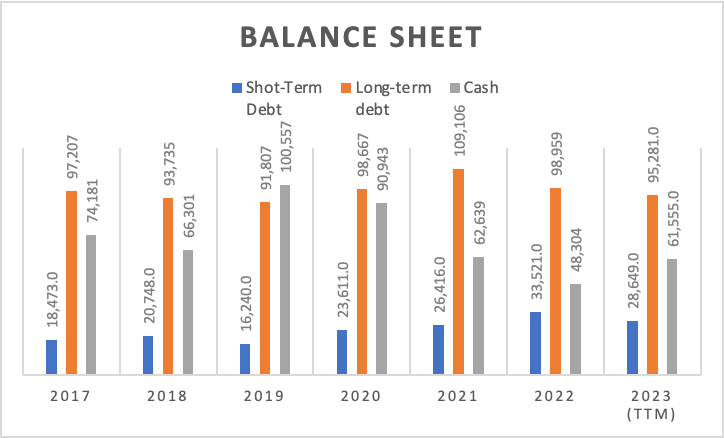
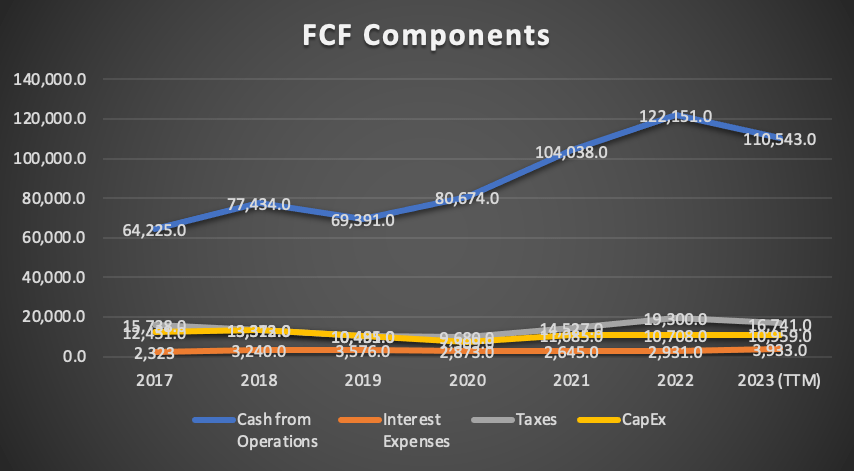
Free cash flow also saw a slight decrease, shifting from a Q3 2023 TTM figure of $88.1 billion to a Q4 2023 TTM figure of $86.77 billion. This reduction in free cash flow was accompanied by a slight decrease in the free cash flow margin, moving from 22.9% to 22.6%.
Author’s Calculations Author’s Calculations Author’s Calculations

In summary, Apple maintains its strength, and while there were minor decreases in key metrics, such as margins, revenue, and cash flow from Q3 to Q4 2023, these changes are relatively insignificant when compared to Apple’s historical growth trends.
Valuation
In this valuation analysis, I will employ two models. The first model will incorporate analysts’ estimates for Apple, while the second model will feature my revised estimates.
For both models, depreciation and amortization (D&A), interest expenses, and CapEx will be computed based on margin percentages relative to revenue. The WACC will be determined using the variables of equity value, debt value, and cost of debt, which can be located in the assumptions table for each model.
Analysts’ Estimates
In this first scenario, I will determine the present fair value of Apple based on the growth trajectory expected by analysts.
| TABLE OF ASSUMPTIONS | |
| (Current data) | |
| Assumptions Part 1 | |
| Equity Value | 62,146.00 |
| Debt Value | 123,930.00 |
| Cost of Debt | 3.17% |
| Tax Rate | 14.72% |
| 10y Treasury | 4.80% |
| Beta | 1.23 |
| Market Return | 10.50% |
| Cost of Equity | 11.81% |
| Assumptions Part 2 | |
| EBIT | |
| Tax | 16,741.00 |
| D&A | 11,519.00 |
| CapEx | 10,959.00 |
| Capex Margin | 2.86% |
| Assumption Part 3 | |
| Net Income | 96,995.00 |
| Interest | 3,933.00 |
| Tax | 16,741.00 |
| D&A | 11,519.00 |
| Ebitda | 129,188.00 |
| D&A Margin | 3.01% |
| Interest Expense Margin | 1.03% |
| Revenue | 383,285.0 |
Analysts anticipate that Apple’s revenue will grow at a rate of 2.11%, and the EPS will increase at a rate of 9.83%. As shown in the tables below, for the fiscal year 2023, analysts project Apple’s revenue to reach $396.91 billion, and for the fiscal year 2024, $419.88 billion.
Seeking Alpha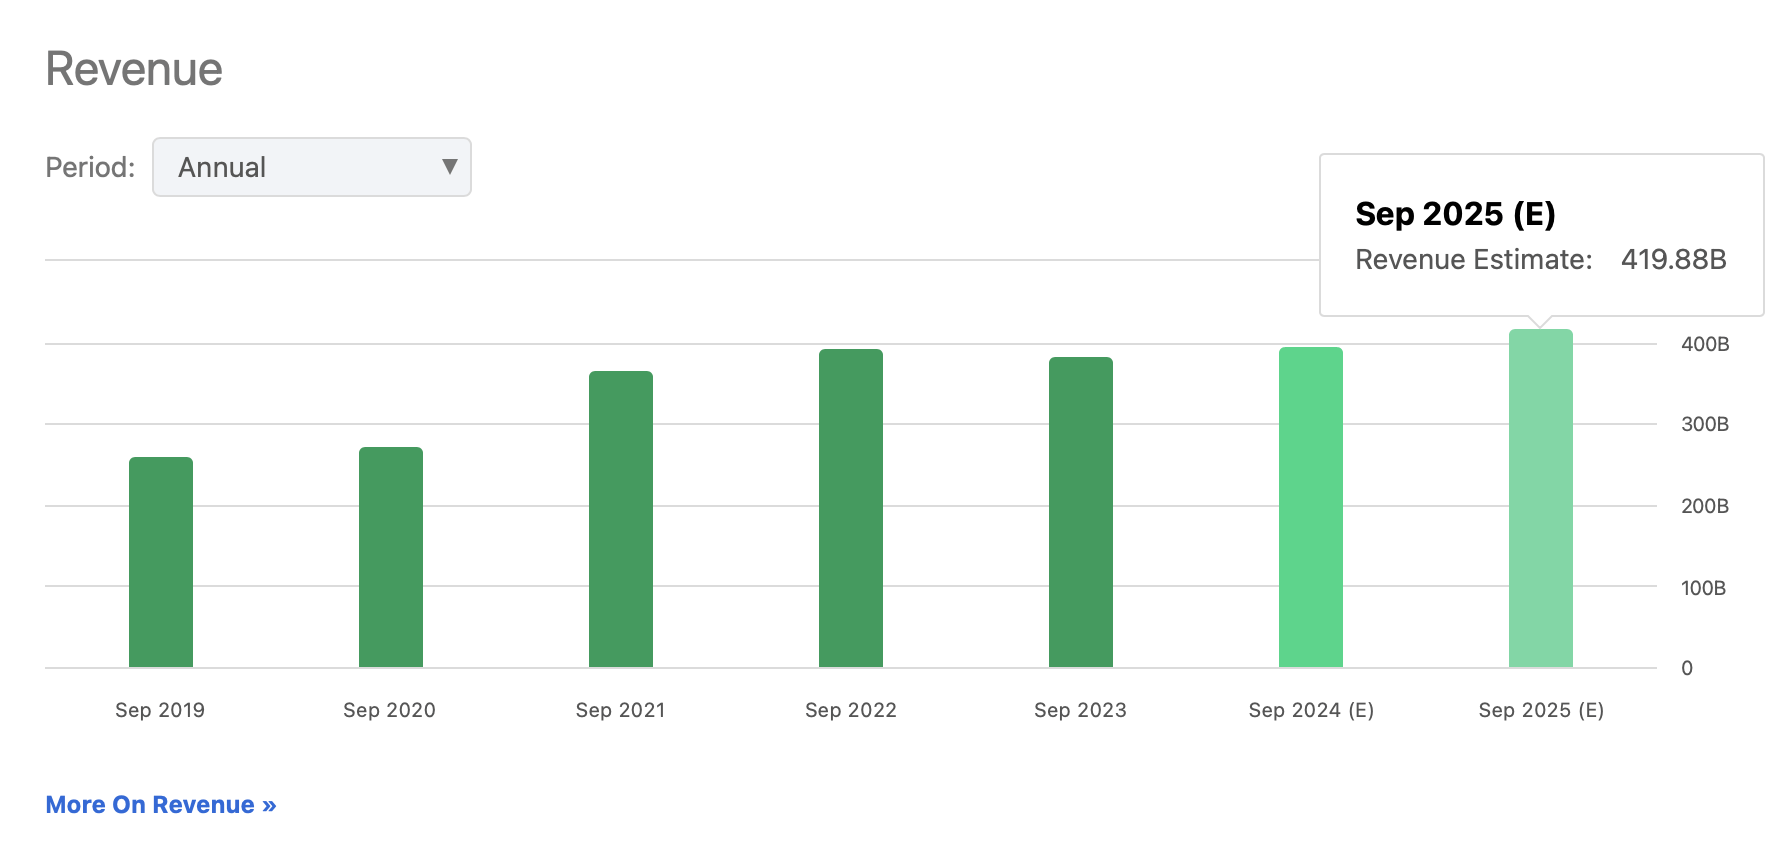
Regarding EPS, analysts project that for the fiscal year 2023, Apple will achieve an EPS of approximately $6.53, equivalent to $101.54 billion. For the fiscal year 2024, Apple’s expected EPS is around $7.09, equivalent to $110 billion.
Seeking Alpha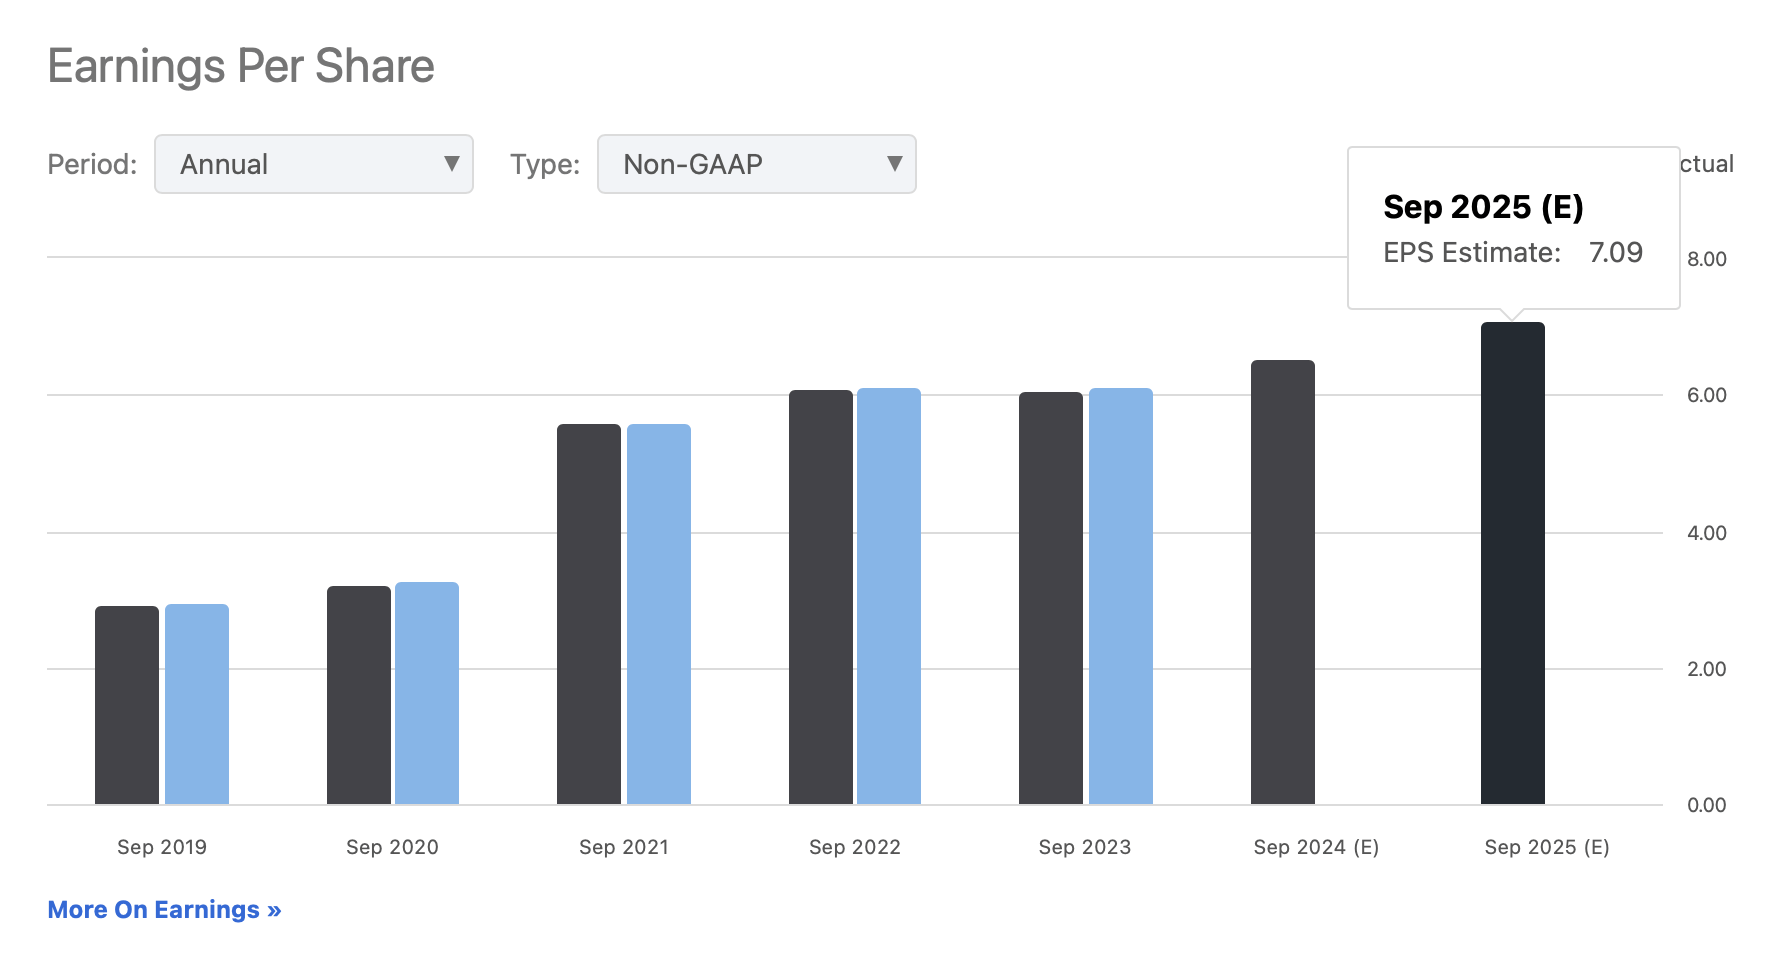
| Revenue | Net Income | Plus Taxes | Plus D&A | Plus Interest | |
| 2023 | $396,140.0 | $101,541.00 | $116,487.00 | $129,105.80 | $130,237.10 |
| 2024 | $419,880.0 | $110,249.00 | $126,476.74 | $139,095.54 | $143,404.06 |
| 2025 | $428,739.5 | $121,108.53 | $138,934.70 | $151,819.76 | $156,219.18 |
| 2026 | $437,785.9 | $133,037.72 | $152,619.77 | $165,776.70 | $170,268.95 |
| 2027 | $447,023.2 | $146,141.93 | $167,652.82 | $181,087.36 | $185,674.40 |
| 2028 | $456,455.3 | $160,536.91 | $184,166.62 | $184,166.62 | $184,166.62 |
| ^Final EBITA^ |
Author’s Calculations
According to analysts’ estimates, Apple’s stock price should ideally reach $220.8, representing a 25% increase from the current stock price of $176.7 in order to achieve fair valuation. Subsequently, the stock could potentially yield annual returns of around 12% until it reaches the projected future value of approximately $303.9.
My Old Estimates
Here are my previous estimates, and upon review, they align with the 2023 revenue projection. However, for the fiscal year 2024, my estimate exceeds the $396.91 billion forecasted by analysts. Nonetheless, for fiscal year 2025, my projections fall short of the $419.88 billion anticipated by analysts. The most significant variance between my estimates and those of analysts is in net income expectations. For fiscal year 2024, I anticipate a net income of $93.71 billion, which is notably lower than the $101.54 billion expected by analysts, representing a difference of $7.81 billion. Similarly, for fiscal year 2025, my estimate of $96 billion in net income falls short of the $110 billion projected by analysts, reflecting a discrepancy of $14 billion.
| Revenue | Net Income | Plus Taxes | Plus D&A | Plus Interest | |
| 2023 | $383,330.00 | $88,472.56 | $101,684.48 | $114,334.37 | $118,083.33 |
| 2024 | $406,060.00 | $93,718.65 | $107,713.98 | $121,113.96 | $125,085.22 |
| 2025 | $417,340.47 | $96,322.18 | $110,706.30 | $124,478.54 | $128,560.13 |
| 2026 | $441,151.07 | $101,817.67 | $117,022.45 | $131,580.44 | $135,894.89 |
| 2027 | $467,459.20 | $107,889.58 | $124,001.11 | $139,427.26 | $143,999.01 |
| 2028 | $496,592.99 | $114,613.66 | $131,729.32 | $148,116.89 | $152,973.57 |
| ^Final EBITA^ |
Author’s Calculations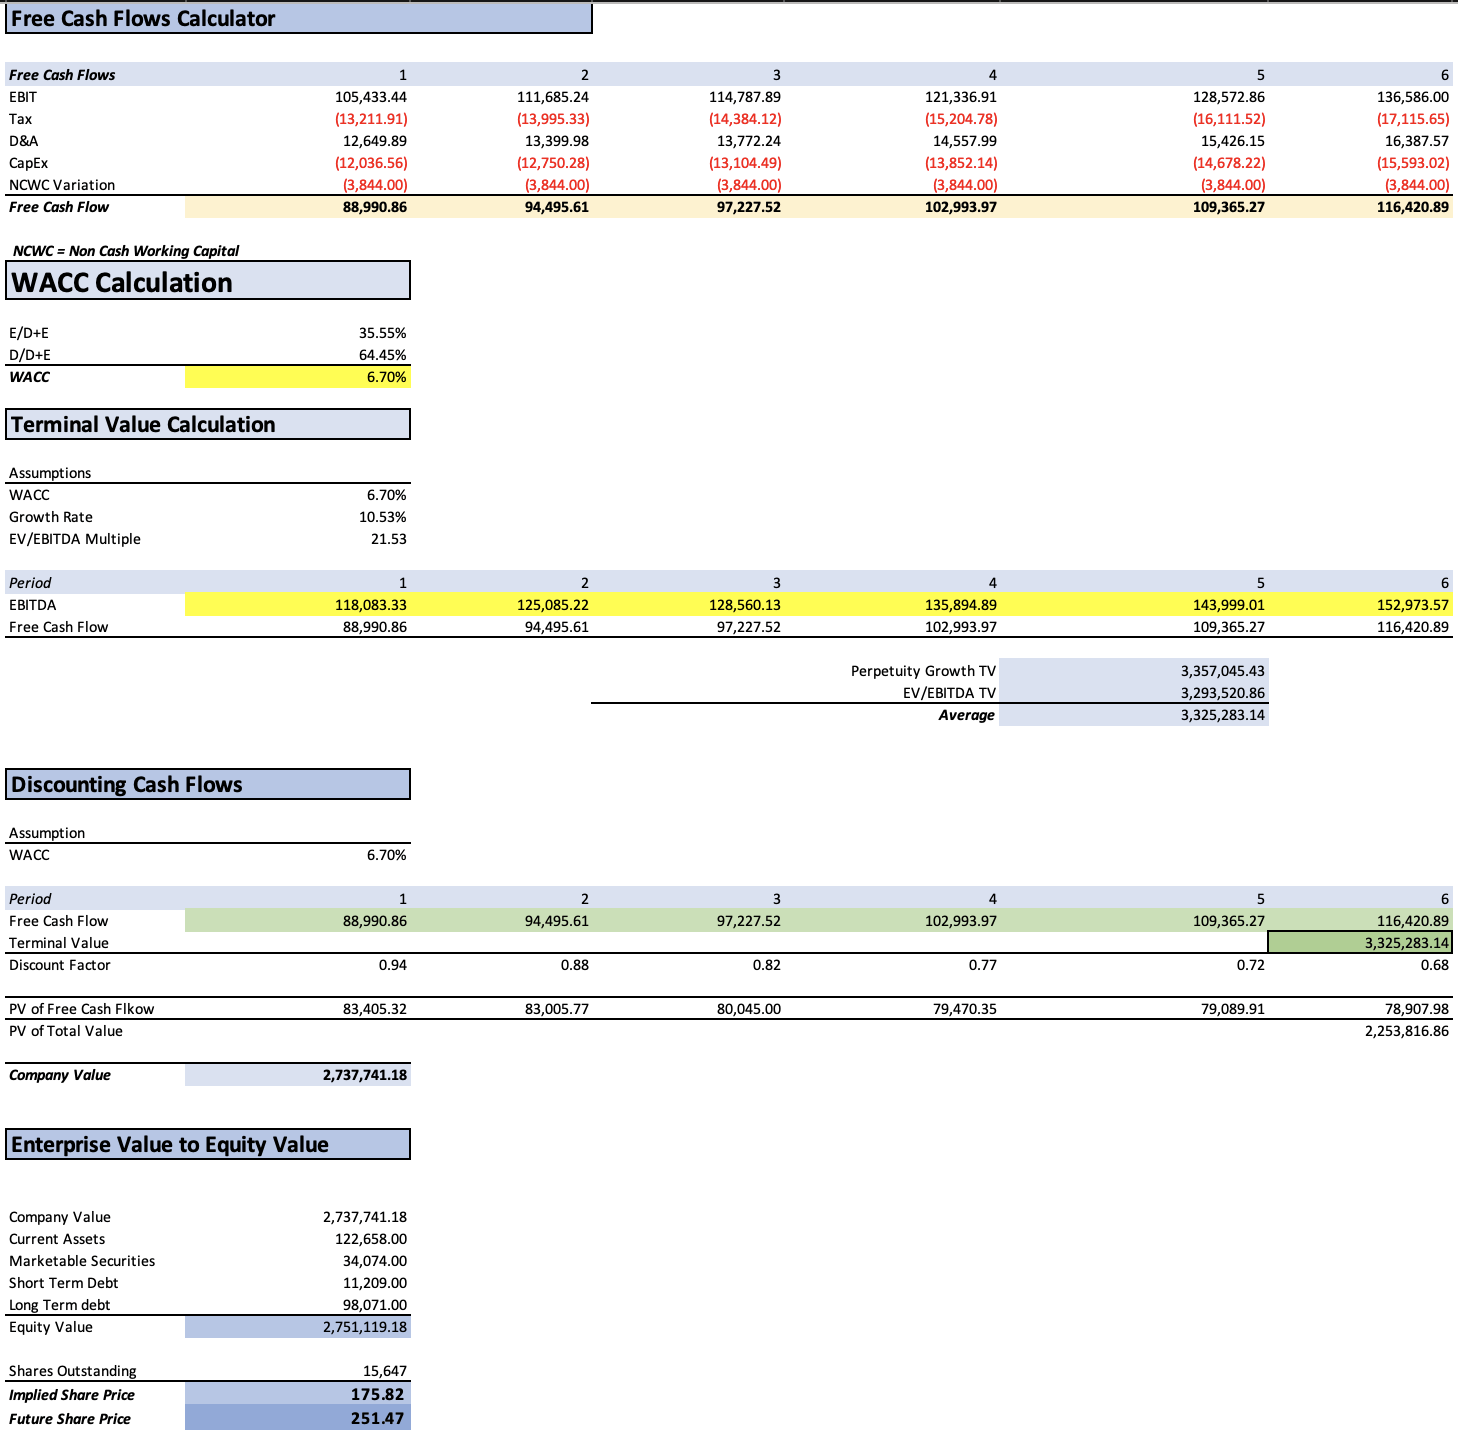
As evident from this analysis, Apple’s fair value is assessed at $175.82, a figure remarkably close to its current stock price of $176.7. Looking ahead, the projected future price stands at $251.47, indicating a substantial 43% upside potential and an annual return of 8.6%.
My New Estimates
In this final valuation, I will provide an update to my previous estimates, given the conclusion of FY 2023 and the commencement of FY 2024. For this revised version of my estimates, I will continue to rely on the growth prospects discussed in my earlier article about Apple, which can also be found in the Overview section of this article.
| Sale of Consumer Electronics | Apps (Services) | Repairs (services) | Banking (Services) | Wearables, Homes and Accessories | Total | |
| FY 2026 | 223,772.35 | 118,573.31 | 28,909.58 | 9,556.90 | 38,975.92 | 419,788.07 |
| FY 2027 | 228,851.99 | 135,647.87 | 29,950.32 | 10,503.04 | 41,142.98 | 446,096.20 |
| FY 2028 | 234,046.93 | 155,181.16 | 31,028.54 | 11,542.84 | 43,430.53 | 475,229.99 |
| FY 2029 | 239,359.79 | 177,527.25 | 32,145.56 | 12,685.58 | 45,845.27 | 507,563.45 |
As you can observe, my net revenue and net income projections remain consistent with my previous estimates, except for the addition of FY 2029 in the projection.
| Revenue | Net Income | Plus Taxes | Plus D&A | Plus Interest | |
| FY 2024 | $396,140.0 | $91,429.11 | $104,886.72 | $116,792.06 | $120,856.97 |
| FY 2025 | $420,030.0 | $96,942.92 | $111,212.12 | $123,117.46 | $127,182.37 |
| FY 2026 | $441,151.07 | $101,817.67 | $116,804.39 | $130,062.46 | $134,589.24 |
| FY 2027 | $467,459.20 | $107,889.58 | $123,770.04 | $137,818.76 | $142,615.49 |
| FY 2028 | $496,592.99 | $114,613.66 | $131,483.85 | $146,408.13 | $151,503.82 |
| FY 2029 | $528,926.45 | $122,076.22 | $140,044.84 | $155,940.85 | $161,368.32 |
| ^Final EBITA^ |
Author’s Calculations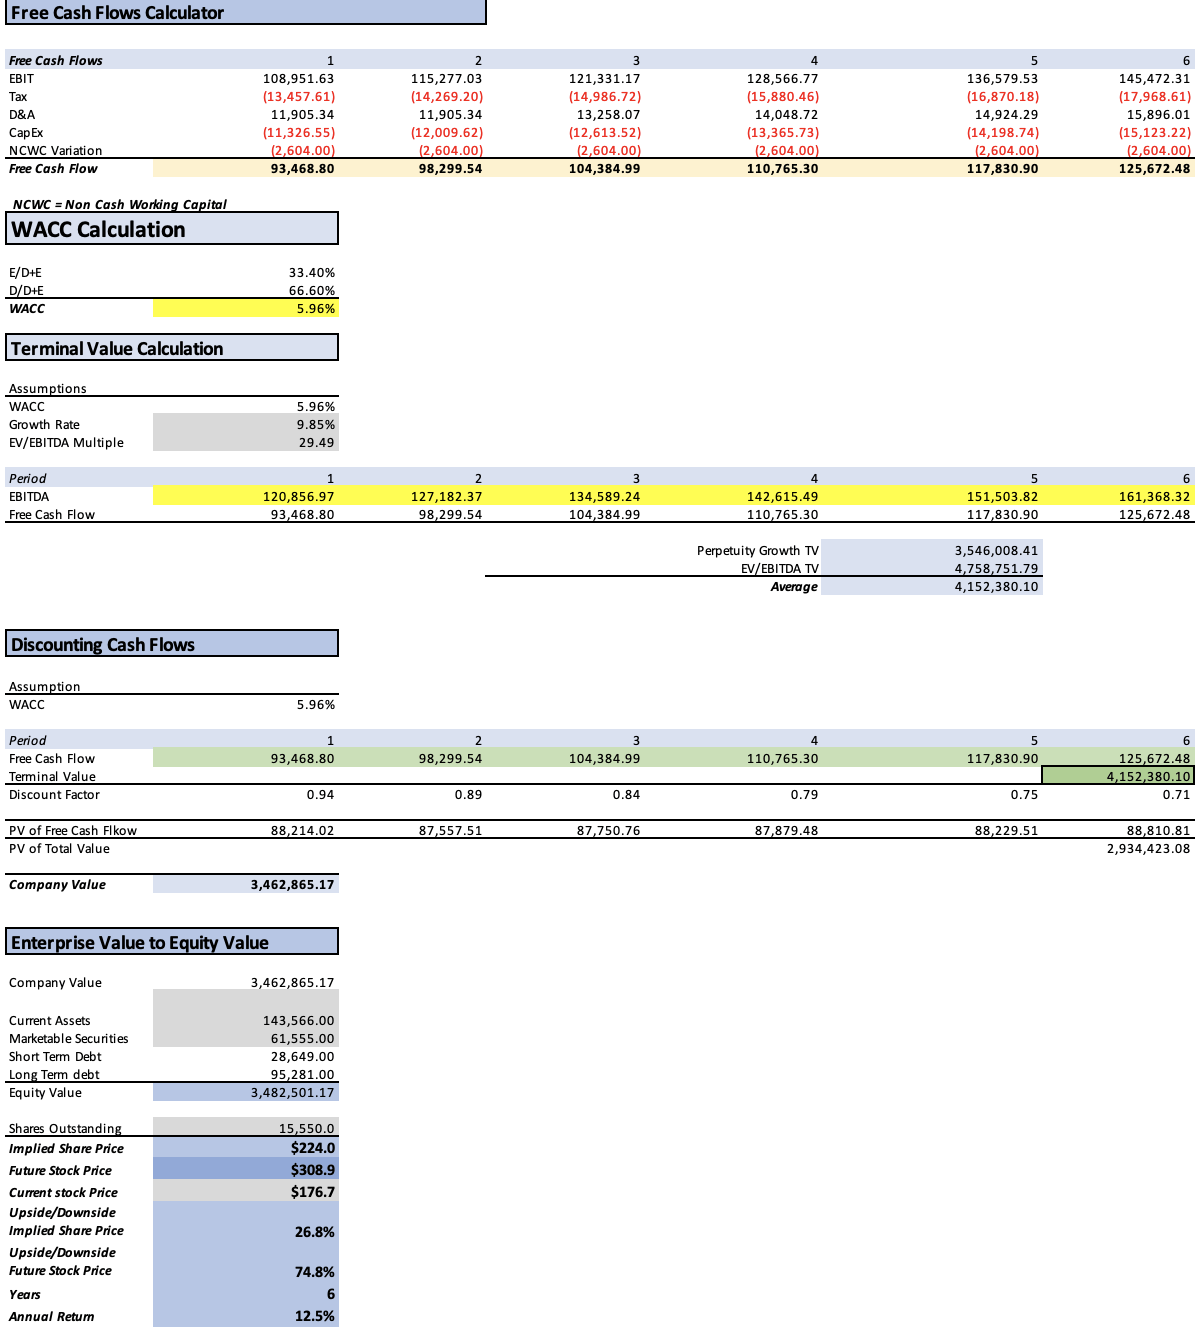
According to my DCF analysis, the fair present value stands at $224, representing a 26.8% increase over the current stock price of $176.7. Subsequently, the anticipated future stock price of $308.9 suggests potential annual returns of 12.5%.
Risks to Thesis
Following the explanation that China’s potential ban on the iPhone poses a relatively minor risk to Apple’s stock, the primary remaining concern centers around macroeconomic factors. In the event of an economic downturn, Apple could witness a decline in its flagship product, the iPhone. It’s worth noting that both Mac and iPad sales have already experienced YoY slumps, leaving the iPhone susceptible to a similar trend.
| Advanced Economies Growth | Emerging & Developing Growth | Avg World GDP per Capita Growth % | Apple Revenue Growth | |
| 2018 | 4.3% | 5.8% | 5.0% | 15.9% |
| 2019 | 3.1% | 4.1% | 3.6% | -2.0% |
| 2020 | -3.5% | -1.8% | -2.6% | 5.5% |
| 2021 | 10.0% | 10.9% | 10.5% | 33.3% |
| 2022 | 9.4% | 10.1% | 9.8% | 7.8% |
| 2023 | 4.7% | 6.8% | 5.7% | -2.6% |
| Correlation | 50.5% | 49.2% | 49.9% | |
| Covariance | 0.3339% | 0.3030% | 0.3184% |
Over the long term, Apple’s ability to sustain innovation is paramount. Without continuous innovation, the allure of its phones could wane. Apple is more than just a phone; it’s a status symbol. This distinction underscores why Apple’s growth narrative remains alive. As illustrated in a table in my prior article, during periods of significant increases in global GDP per capita, Apple also experiences substantial growth in sales.
Furthermore, it’s important to remember that iPhone users constitute only about 19% of the world’s population. To put it in perspective, if Apple were to attract an additional 2 billion people to purchase iPhones at an average price of $1,000, this would translate to $2 trillion in revenue. The potential value is immense. Of course, achieving such a volume of iPhone sales would require the expansion of production capabilities, a task not easily accomplished within a 12-month timeframe, at least for Apple. Given the current iPhone production rate of around 617,000 units per day (calculated by dividing the 2022 shipments of approximately 225.39 million by 365 days), producing 2 billion iPhones would take approximately 8.8 years. However, the opportunity remains, and Apple’s growth story is far from over.
Conclusion
In conclusion, despite uncertainties in the market, Apple’s resilience, innovation, and the untapped potential of expanding its user base make it an attractive investment choice. The company’s capacity to adapt to changing circumstances and consistently deliver remarkable products underscores its long-term promise.
In light of the updated estimates and the factors discussed, it becomes evident that Apple’s growth story remains compelling. While there may be fluctuations in short-term projections, the overarching narrative of Apple’s potential is one of enduring value. With my refreshed estimates indicating a favorable present fair value, coupled with the belief that Apple’s innovation and its ability to tap into a substantial global market provide ample room for growth, I reaffirm my “buy” rating on Apple.