Nikada/iStock Unreleased via Getty Images
The first thing to note when looking at Apple’s financial report (NASDAQ:AAPL) is that the revenue has decreased by -2.80% in 2023 compared to 2022. This also leads the growth of net income to decrease to -2.81% in response to 5.51% and 64.92% in 2022 and 2021, respectively. In contrast, revenue increased by 33.26% in 2021 and 7.79% in 2022. This is a rather negative sign indicating a decline in Apple’s revenue and net income from 2021 to 2023, which has also occurred previously in 2019.
If we take the Gross Profit divided by the Cost of revenues, we see a decreasing ratio. Specifically, for the years 2021, 2022, and 2023, the ratios are 1.39, 1.3, and 1.26, respectively. In simple terms, in 2021, every dollar of cost of revenues generated $1.39 in profit, but in 2023, every dollar of cost of revenues only generated $1.26 in profit. This means that business efficiency is gradually decreasing.
Revenue increased by 33.26% in 2021 and 7.79% in 2022. (Seeking Alpha) The revenue has decreased by -2.80% in 2023 compared to 2022. (Seeking Alpha)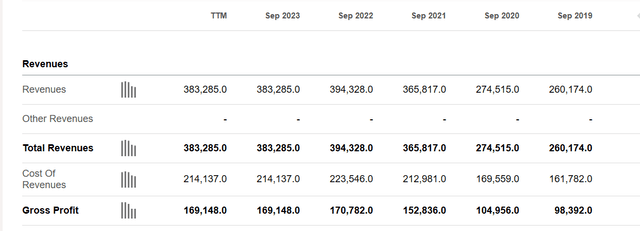

We do a similar analysis with operating income, by taking total operating expenses and dividing them by operating income, resulting in an increasing ratio. Specifically, in 2021, it was 0.4, in 2022, it was 0.43, and in 2023, it increased to 0.48. In simple terms, in 2021, every dollar of operating expenses generated $0.4 in operating income, but in 2023, every dollar of operating expenses generated $0.48 in operating income. This indicates that Apple has effectively managed its operating expenses.
In 2021, every dollar of operating expenses generated $0.4 in operating income, but in 2023, every dollar of operating expenses generated $0.48 in operating income. (Seeking Alpha)
Continuing with the analysis, when we take the income tax expense divided by earnings from continuing operations, we obtain a somewhat unfavorable ratio. Specifically, in 2021, it was 0.15, in 2022, it increased to 0.19, and in 2023, it decreased to 0.17. For every dollar of income tax expense, it generated $0.19 in earnings in 2022, but only $0.17 in earnings in 2023. The main reason for this is likely related to unusual items.
For every dollar of income tax expense, it generated $0.19 in earnings in 2022, but only $0.17 in earnings in 2023. (Seeking Alpha)
The company has effectively managed its cash and total receivables, which is why the total cash & short-term investments are consistently stable. This is a positive signal for the company’s liquidity and is likely to have a favorable impact on the stock’s value.
The total cash & short-term investments are consistently stable. (Seeking Alpha)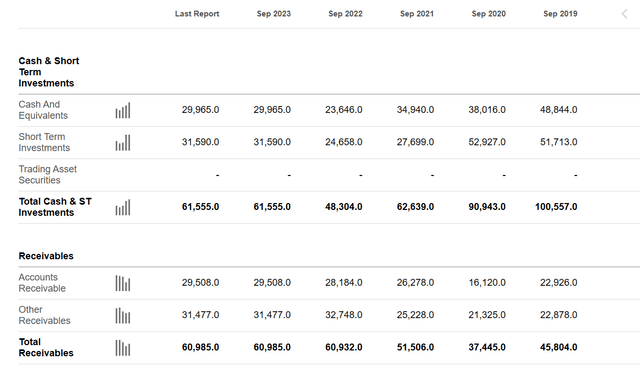
The consistent maintenance of Depreciation & Amortization Total indicates that the company’s production activities are being stably managed.
Depreciation & Amortization Total indicates that the company’s production activities are being stably managed. (Seeking Alpha)
Looking at the profitability grade calculated by Seeking Alpha, we observe that all the metrics are assessed favorably, with the exception of the Gross Profit Margin. In general, the profitability of Apple’s business operations is evaluated as quite positive. Some critical ratios, such as return on common equity (ROCE), return on total capital (ROTC) and return on total assets (ROTA), all received an A+ grade. Apple’s ROCE stands at an impressive 171.95%, while the sector median is only 1.13%. This is a significant achievement, indicating that Apple generates significantly more profit from its equity investments, providing the company with ample cash for its business operations and dividend payments. Furthermore, it demonstrates that the company is utilizing its equity capital efficiently to create value for the business.
Meanwhile, the ROTC is at a significant 38.7%, which is much higher than the sector median of 2.57%. This indicates that Apple has effectively utilized its capital structure, which includes both equity and debt, to generate profits efficiently. This metric shows that the business is managing its operations effectively to generate profits. Since this ratio takes into account both equity and debt, it provides a comprehensive and accurate view of the company’s profitability compared to ROCE.
Looking at ROTA, the figure is also quite impressive, standing at 27.51%, while the sector median is only 0.09%. This number indicates that Apple is utilizing its assets efficiently to generate earnings.
We observe that all the metrics are assessed favorably, with the exception of the Gross Profit Margin. (Seeking Alpha) The company with ample cash for its business operations and dividend payments. (Seeking Alpha) Apple is utilizing its assets efficiently to generate earnings. (Seeking Alpha)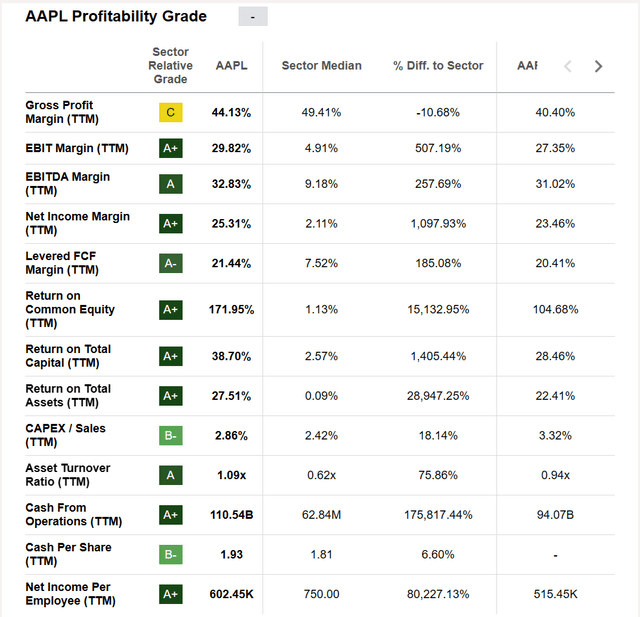

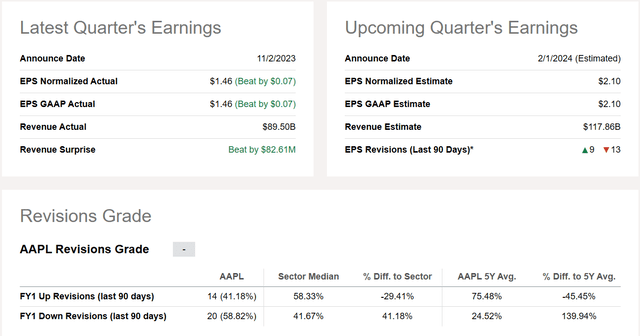
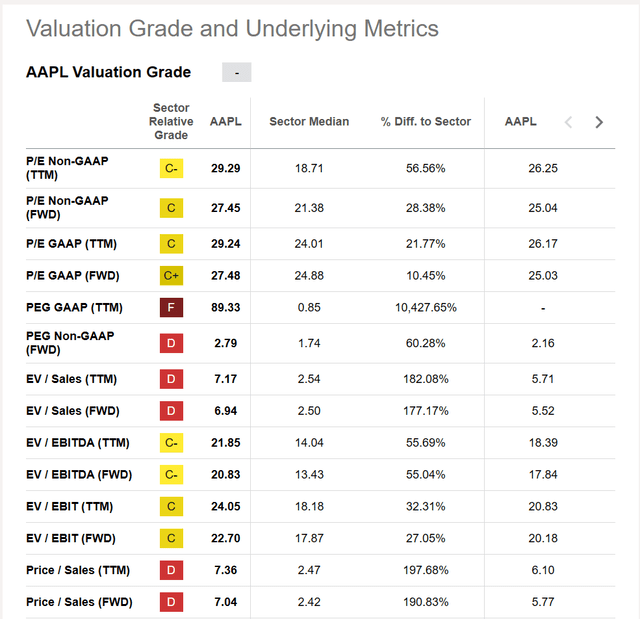
However, the growth grade, and underlying metrics, and valuation are consistently rated unfavorably according to the table by Seeking Alpha.
Apple growth grade is too low. (Seeking Alpha) AAPL valuation is too high. (Seeking Alpha) AAPL valuation is too high. (Seeking Alpha)

In terms of technical analysis, AAPL seems to retest the price range of $130 – $140. This is a good entry zone for long-term investors.
The yellow zone is a good entry for long-term investors. (Tradingview)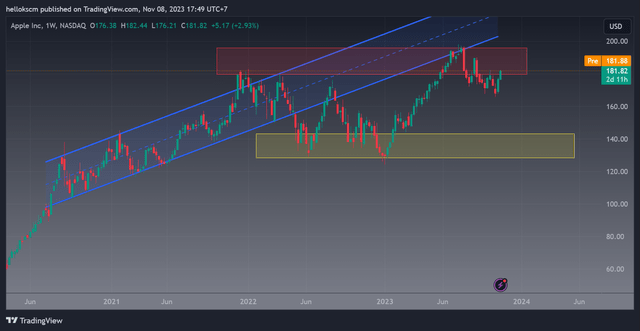
Apple’s stock is currently trading at a relatively high valuation compared to its revenue and profit. It can be a good stock for long-term holding, but at its current price, it might not be in the “safe” buying zone.

